
Electrical equipment forms the backbone of modern industrial and utility operations, including power generation, transmission and distribution networks, renewable energy facilities, manufacturing plants, and hyperscale data centers. As global demand for reliable and uninterrupted power continues to rise, capital budget constraints and extended lead times for critical components are forcing organizations to place greater emphasis on maximizing the operational life of existing assets.
THE IMPORTANCE OF EXTENDING ELECTRICAL EQUIPMENT LIFESPAN
In this context, extending equipment lifespan is no longer viewed as a purely maintenance-driven objective, but rather as a strategic business requirement tied directly to operational resilience, financial performance, and long-term infrastructure planning.
Modern asset management strategies increasingly focus on extracting maximum value from installed equipment through advanced diagnostics, predictive maintenance, and condition-based monitoring. This shift reflects both economic realities and the growing complexity of electrical networks, where equipment failures can have cascading operational and regulatory consequences.
RISING PRESSURES ON POWER INFRASTRUCTURE
Over the past several decades, electrical infrastructure has been subjected to steadily increasing operational stress, driven by multiple converging factors:
- Aging asset populations, with a significant portion of transformers, switchgear, cables, and rotating machines operating at or beyond their original design life
- Higher and more dynamic load profiles, resulting from the electrification of transportation, the rapid expansion of renewable generation, and the exponential growth of energy-intensive data centers
- Environmental and climatic challenges, including more frequent and severe weather events such as heat waves, wildfires, hurricanes, flooding, and airborne contamination
- Stricter regulatory oversight and reliability requirements, with tighter performance indices for service continuity and system resilience
These external and internal stressors accelerate insulation aging, thermal cycling, mechanical fatigue, and contamination-related degradation in electrical equipment. Without corresponding evolution in inspection and maintenance methodologies, the probability of unexpected failures increases significantly.
FINANCIAL IMPACT OF ASSET LONGEVITY
Replacing major electrical assets requires substantial capital expenditure and long project timelines. Extending the operational life of these assets delivers measurable financial and operational advantages:
- Reduced capital expenditure (CAPEX) by deferring or eliminating the need for premature asset replacement
- Lower operating expenditure (OPEX) through targeted, condition-based maintenance rather than blanket time-based interventions
- Minimized unplanned downtime, protecting production output, service reliability, and contractual service-level agreements
- Improved total cost of ownership (TCO) across the full lifecycle of electrical assets
In addition, insurance and risk exposure are directly influenced by asset health-management practices. Insurers increasingly recognize the value of predictive and non-destructive diagnostic technologies, as they reduce the likelihood of catastrophic failures, secondary damage, and fire-related incidents. Utilities and industrial operators that adopt advanced condition monitoring often benefit from more favorable insurance terms, lower risk premiums, and improved long-term insurability due to reduced loss profiles and stabilized risk exposure.
For utilities and large industrial facilities, each additional year of reliable operation from critical assets can translate into millions of dollars in avoided replacement costs, reduced outage penalties, and improved system reliability.
THE POTENTIAL–FAILURE CURVE
The potential–failure (P-F) curve (Figure 1) is a foundational reliability engineering model that describes how faults in electrical equipment develop over time. Rather than viewing failure as a sudden event, the P–F curve shows that most failures are the result of progressive degradation that can be detected long before the equipment stops functioning.
- The horizontal axis (X-axis) represents time or operational exposure, typically expressed as operating hours, load cycles, switching operations, or calendar time.
- The vertical axis (Y-axis) represents the asset condition or resistance to failure, which reflects the health of critical elements such as insulation systems, mechanical integrity, and thermal stability.

As time progresses along the X-axis, the asset’s condition shown on the Y-axis gradually declines. This degradation is rarely linear and is most often represented by a non-linear or exponential curve, reflecting the accelerating nature of aging and damage mechanisms in electrical equipment.
Defining the P and F Points
Two critical points define the model:
- Point P – Potential Failure is the moment at which a defect becomes detectable through appropriate diagnostic technologies, even though the asset is still operating within acceptable performance limits.
- Point F – Functional Failure is the point at which the asset can no longer perform its intended function, resulting in forced outages, safety risks, or equipment damage.
The time between these two points is known as the P–F interval. This interval represents the practical window available to detect, diagnose, and correct developing faults before they evolve into full failure.
How the P–F Curve Applies to Electrical Assets
Failures in electrical systems rarely occur instantaneously. They develop through progressive mechanisms such as:
- Insulation aging and degradation
- Partial discharge and corona activity
- Thermal overstress and localized heating
- Mechanical loosening and fatigue
These processes start far in advance of functional failure and may remain invisible without advanced diagnostic tools. The P–F curve conceptually explains when different technologies can detect these phenomena and how early intervention is possible.
The Strategic Role of Advanced Inspection Tools
While the P–F curve explains how failures develop over time, it does not, by itself, prevent failure. The practical value of the model lies in the ability to observe and measure real-world physical and electrical phenomena that occur along this degradation path. Without appropriate diagnostic tools, the early stages of failure remain invisible, and the opportunity to intervene within the P–F interval is lost.
This is where modern inspection technologies become essential. Each technology is designed to detect specific physical signatures—electrical, thermal, acoustic, visual, or chemical—that appear at different stages of the degradation process. By aligning inspection tools with the stages defined by the P–F curve, asset owners can transform a theoretical reliability model into a practical, data-driven maintenance strategy that actively extends equipment life and improves system reliability.
Solar-Blind UV Imaging
Position on the P–F curve: Very close to Point P
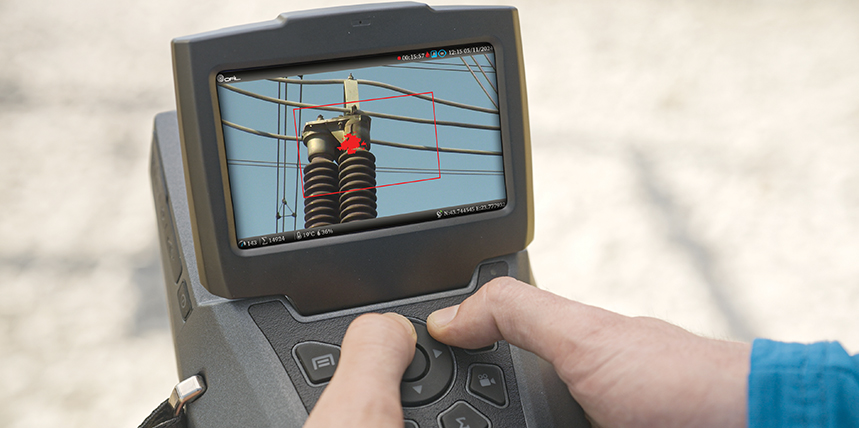
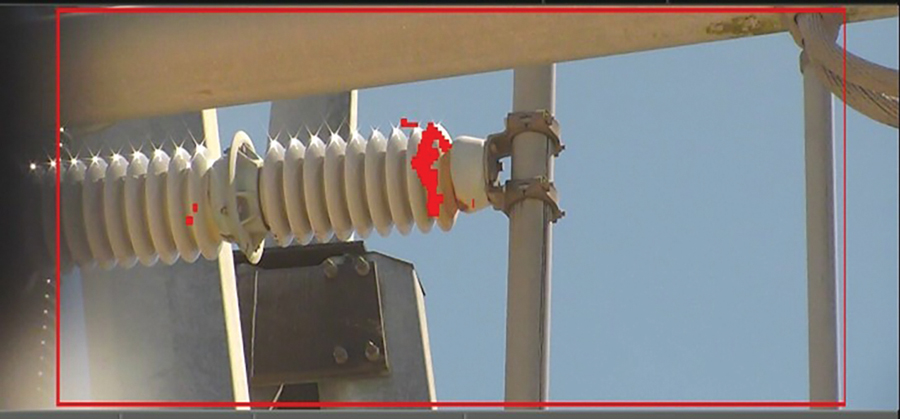
Solar-blind ultraviolet (SBUV) imaging detects electromagnetic emissions in the 240–280 nm wavelength range, where natural sunlight is filtered by the atmosphere. This enables the detection of faint ultraviolet photons generated by corona partial discharge, surface partial discharge, and arcing that are often early warning signs of potential faults (Figure 2). Such detections can take place even under daylight conditions.


SBUV cameras are designed as bi-spectral imaging devices, operating at two spectral bands: the solar-blind UV-C band and the visible light band. They produce output images by merging UV and visible light imagery, thereby presenting a comprehensive view of the observed scene.
Solar-blind UV technology can detect faults such as:
- Local electric field intensification caused by improper design or installation
- Early-stage insulation stress
- Contamination-driven discharge activity
- Microdefects on energized hardware, mechanical damage, breaks, cracks, broken strands, loose components, and more.
Because corona and surface PD are typically among the earliest measurable symptoms of electrical degradation, SBUV operates extremely close to Point P, often identifying defects long before heat, sound, or visual damage appears.
Dissolved Gas Analysis (DGA)
Position on the P–F curve: Very close to Point P (for oil-filled equipment)
DGA is a chemical diagnostic technique applied primarily to oil-filled transformers and bushings. It detects fault-generated gases dissolved in insulating oil (Figure 3).

Key diagnostic gases include:
- Hydrogen (H₂). Indicates partial discharge and corona, often linked to insulation defects or moisture ingress.
- Acetylene (C₂H₂). Signals high-energy arcing and represents a critical fault condition
- Carbon Monoxide (CO) and Carbon Dioxide (CO₂). Reflect the thermal degradation of paper insulation.
- Methane (CH₄). Associated with low-temperature thermal faults and overheating components.
- Ethylene (C₂H₄) and Ethane (C₂H₆). Indicate thermal decomposition.
DGA provides internal visibility of electrical and thermal faults that are completely inaccessible to external inspection. Because gas generation begins at the very earliest stages of fault activity, DGA is considered one of the closest technologies to Point P for sealed, oil-filled systems.
Acoustic and Ultrasonic Inspection
Position on the P–F curve: Mid-range between P and F
Acoustic and ultrasonic techniques (Figure 4) detect high-frequency sound emissions produced by:
- Partial discharge and arcing
- Mechanical looseness and vibrations
- Gas leaks
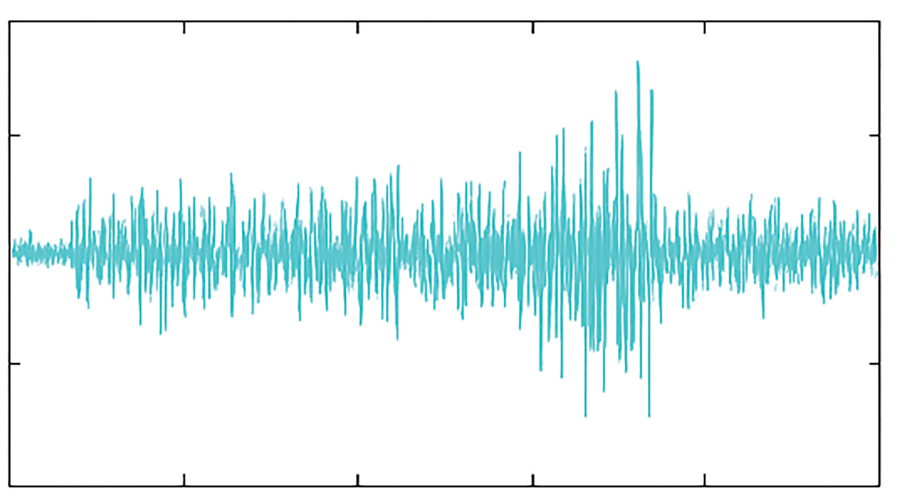
These methods are particularly effective in enclosed environments, such as switchgear. However, audible and ultrasonic emissions usually occur after electrical or chemical degradation has intensified, placing these tools further from Point P and closer to mid-to-late stages of the P–F interval.
Infrared Thermography
Position on the P–F curve: Middle to late stages
Infrared (IR) thermography identifies temperature anomalies caused by:
- Resistive heating at poor electrical connections (Figure 5)
- Conductor overload
- Phase imbalance
- Insulation breakdown progressing to thermal loss

Thermal signatures generally appear after electrical stress and partial discharges have been active for some time. As a result, IR thermography is positioned further along the P–F curve, detecting faults typically in the late stages of degradation.
Visual and High-Resolution RGB Inspection
Position on the P–F curve: Close to Point F
Red-green-blue (RGB) Visual inspection detects:
- Cracks and fractures
- Burning and carbonization
- Corrosion and contamination buildup (Figure 6)
- Deformation and mechanical damage
These are typically late-stage symptoms, appearing only after significant damage has already occurred. As a result, visual inspection is positioned closest to Point F, where corrective actions tend to be reactive, urgent, and costly.
CASE STUDIES: USING UV TECHNOLOGY TO PREVENT FAILURES AND EXTEND ASSET LIFESPAN
How UV Technology Extends Lifespan
Electrical assets rarely fail without warning. Long before a transformer flashes over, a switchgear panel trips, or an insulator shatters, the equipment enters a silent deterioration phase—often beginning with small, localized electrical discharges that gradually weaken insulation systems.
UV cameras detect corona and surface partial discharge at their very earliest stages—often months before damage becomes visible through other inspection methods. By revealing microscopic defects, poor assembly practices, installation errors, contamination, moisture-related stress, and emerging insulation breakdown, UV inspection allows operators to intervene long before these issues escalate.
Every hour that partial discharge remains active accelerates insulation aging, erodes surfaces, increases electric field stress, and shortens the usable life of the asset. Interrupting this process early prevents irreversible damage, avoids unexpected outages, and maintains asset integrity for many additional years. In many documented cases, a single UV inspection has prevented failures that would have required costly replacements or extensive repairs.
The following case studies illustrate how utilities and industrial facilities have used UV technology to identify hidden defects, prevent failures, avoid major financial losses, and—most importantly—extend the operational life of critical electrical equipment.
CASE 1: Preventing Partial Discharge in Medium-Voltage Switchgear (European Utility)
A large European utility experienced a series of unexplained outages associated with medium-voltage switchgear. Initial root-cause assumptions focused on extreme cold-weather operating conditions, as the failures appeared during winter periods. However, the recurring nature of the events suggested an underlying equipment integrity issue.
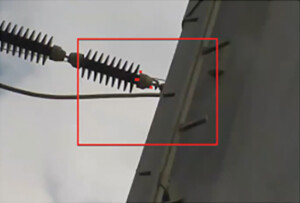
An extensive inspection campaign was conducted using solar-blind UV corona cameras. The survey revealed that approximately 30% of the inspected switchgear population, most of which had been in service for only about 10 years, exhibited active partial discharge (Figure 7). UV imagery revealed concentrated discharge activity along cable terminations and insulation surfaces, visible in inspection imagery as distinct UV emission clusters (red detection zones).
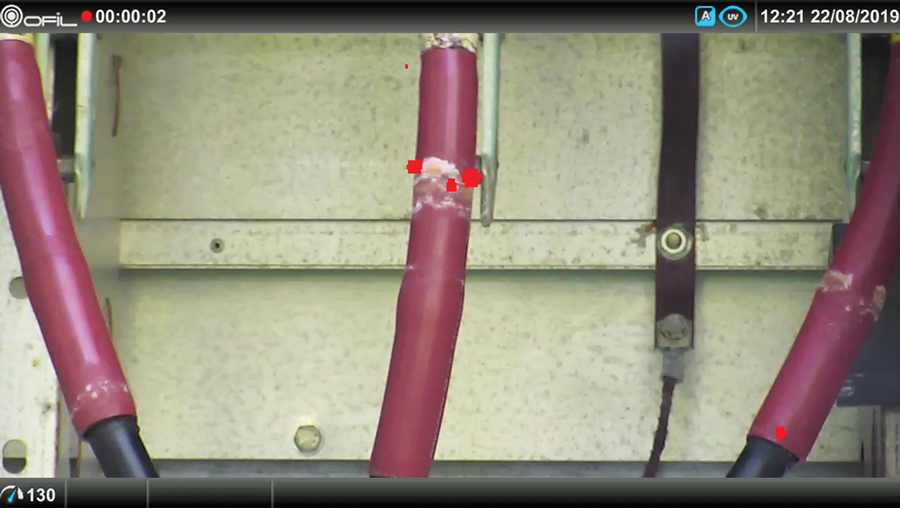
Further technical analysis determined that the root cause was not environmental temperature but improper cable installation practices that introduced mechanical stress and microscopic air gaps in the insulation system. These defects created localized electric field intensification, initiating partial discharge inside the cable insulation. Over time, the persistent PD activity accelerated insulation aging, leading to repeated protection trips and line outages.
The Challenge: Preserving Asset Lifespan
The primary challenge was not only to stop recurring outages, but also to prevent premature aging and early end-of-life of relatively young assets. The switchgear population was only around 10 years old, yet signs of accelerated insulation degradation were already present due to installation-related defects. Without early detection, these assets would have suffered irreversible dielectric damage, forcing early replacement years ahead of their intended service life.
The utility’s objective shifted from reactive repair to stabilizing and extending the operational life of the existing asset base.
The Outcome: Life Extension Through Early Intervention
By using UV inspection to detect partial discharge at an early stage, the utility was able to:
- Eliminate the root causes of accelerated aging
- Restore the insulation integrity before irreversible damage occurs
- Re-standardize installation practices to protect long-term asset health
- Introduce UV inspections as a permanent life-extension strategy
This approach extended the usable lifetime of the affected switchgear, delaying capital replacement cycles and preserving asset value.
CASE 2: Extending Substation Insulator Lifespan in a Chemical Production Facility
During a scheduled condition assessment of a chemical production facility’s high-reliability substation, a solar-blind UV inspection was performed on critical insulation components operating under continuous load. The site required exceptionally high power quality and continuity due to the sensitivity of the production processes and the safety constraints of the operating environment.
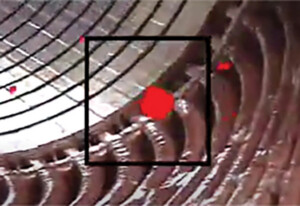
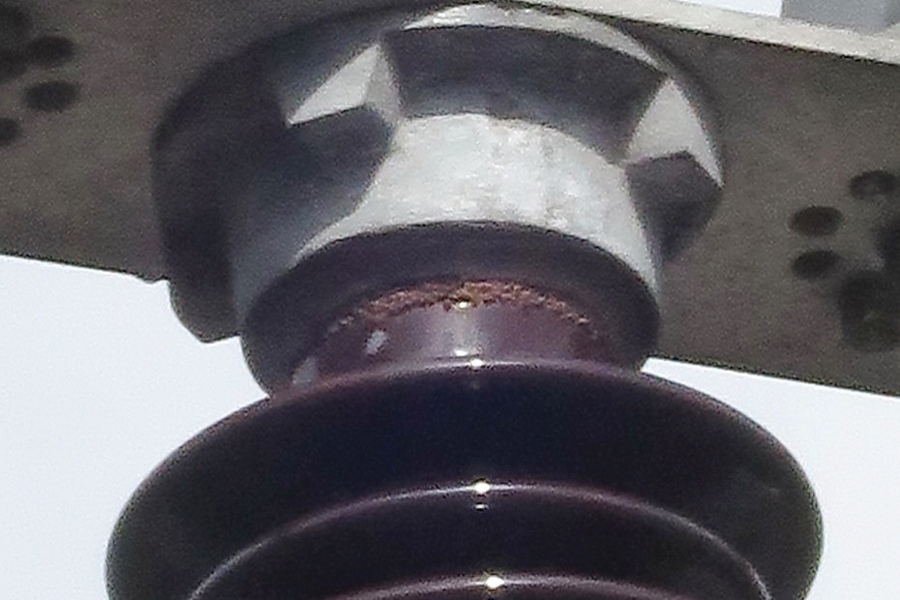
Although no visible damage or thermal anomalies were detected, the UV inspection revealed persistent corona discharge activity concentrated around the metal cap of a critical insulator (Figure 8).
The discharge pattern was stable and repeatable, indicating a structural defect rather than a transient environmental effect. Detailed analysis suggested the presence of a micro-gap between the insulator cap and the insulating body. This gap was likely introduced during installation or developed over time due to mechanical stress, thermal cycling, and structural tension on the line. The gap created a localized electrical field intensification, producing continuous corona activity along the insulator surface. This condition initiated progressive material erosion at the edge of the insulating material.
Environmental exposure significantly accelerated the degradation process:
- Rainwater penetrated the micro-gap.
- Moisture reduced surface insulation resistance.
- Repeated wet–dry cycles increased surface tracking and erosion rates.
Although the insulator was still operational, the combination of continuous corona, moisture ingress, and surface degradation placed the asset on an accelerated path toward early end-of-life.
The Risk to Asset Lifespan
If left undetected, the defect would have resulted in:
- Rapid loss of dielectric strength
- Increased likelihood of flashover
- Structural weakening of the insulator body
Corrective Action and Life Extension Outcome
Based on the UV inspection results, the facility implemented a proactive replacement program before functional failure occurred:
- The affected insulator was replaced at a direct cost of approximately $1,800.
- Mechanical installation procedures were updated to eliminate tolerance gaps.
- A periodic UV inspection program was introduced to monitor similar components.
This proactive approach prevented the defect from progressing into irreversible damage and preserved the long-term integrity of the substation infrastructure.
Return on Investment and Lifecycle Impact
A failure at this location would have forced an emergency shutdown of critical production processes. The facility estimated that such an event would have resulted in:
- Production losses
- Complex and hazardous restart procedures
- Increased safety risk to personnel
- Potential damage to adjacent electrical infrastructure
The estimated avoided financial impact exceeded $350,000, achieved through a relatively low-cost early intervention. More importantly, the early action extended the expected service life of the substation assets, delaying capital replacement and preserving system reliability.
CONCLUSION
Electrical degradation is a gradual process, and the P–F curve demonstrates that the greatest opportunity to preserve asset life lies in detecting faults at their earliest stages. By integrating solar-blind UV imaging with complementary diagnostic tools such as DGA, infrared thermography, acoustic measurements, and visual inspection, operators gain coverage across the full degradation process, from the first microscopic signs of discharge to the later stages of physical damage.
Real-world cases clearly show that early detection not only prevents catastrophic failures but also slows insulation aging, stabilizes asset condition, and extends the usable life of critical electrical infrastructure. As utilities and industrial facilities face increasing reliability demands and constrained replacement budgets, adopting early-stage inspection technologies becomes essential for achieving long-term resilience, safety, and lifecycle cost reduction.

Sheyna Reizes is Vice President of Product at OFIL Systems.She has broad experience in B2B product management across multiple industries and works closely with cross-functional teams, including R&D, sales, and marketing. Sheholds a BS in mechanical engineering from Tel Aviv University and an MBA from The Open University of Israel.