

The global shift towards renewable energy, particularly solar power, is driving the clean energy revolution. However, solar energy’s intermittent nature challenges grid stability and consistent supply. Stationary battery systems offer a crucial solution for energy storage and grid management, capturing excess solar energy during peak hours and releasing it when needed. These advanced systems smooth power fluctuations, provide backup during outages, optimize energy distribution, and build a more resilient and sustainable power infrastructure.
While large-scale stationary battery storage dominates current deployment, small-scale storage is also increasing. Various scenarios project the adoption of battery storage by 2030, with the doubling scenario (Figure 1) showing increased stationary battery storage in response to the goal of doubling renewables in the global energy system by 2030.

Note: GWh = gigawatt-hour; PV = photovoltaic; BTM = behind-the-meter Source: IRENA, 2017[4]
In recent years, the renewable energy sector has witnessed remarkable growth, with photovoltaic (PV) systems, windmills, and other solar energy applications leading the charge towards a sustainable future. As these technologies evolve, so must the methods for testing and evaluating the stationary batteries that support them. This paper delves into the cutting-edge advancements in battery testing techniques specifically designed for renewable energy storage systems. We will explore innovative approaches that address the unique challenges posed by intermittent power sources, varying load demands, and the need for long-term reliability. By examining these developments, we aim to provide insights into how improved testing methodologies are enhancing the efficiency, safety, and longevity of stationary batteries in renewable energy applications.
CONVENTIONAL BATTERY (VLA/VRLA) TESTING
Impedance Testing
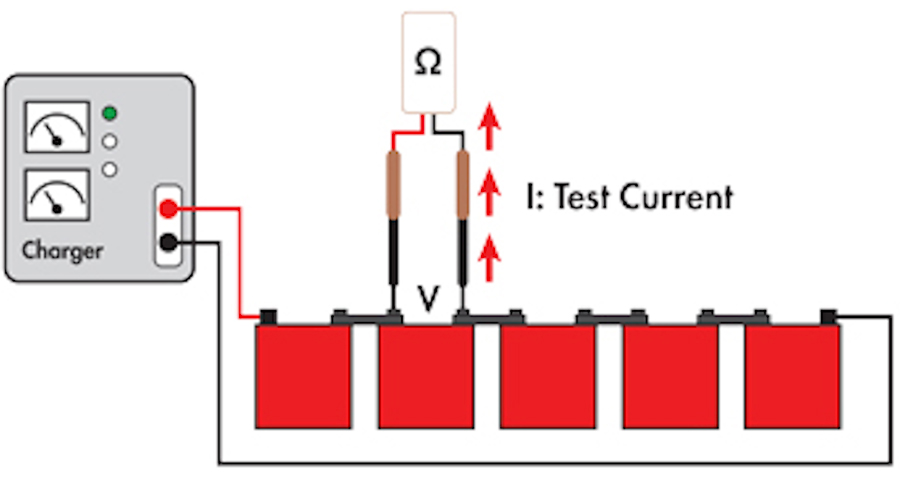
Impedance testing (Figure 2) shows a crucial method for assessing battery health in stationary applications. This non-invasive, online test utilizes a four-lead Kelvin measurement technique, where two leads inject AC current into the battery while the other two measure AC voltage. The internal impedance of each cell, comprising both resistance and capacitive reactance, is then calculated. This method is advantageous as it doesn’t stress or load the battery during testing.
Ohmic Data Analysis
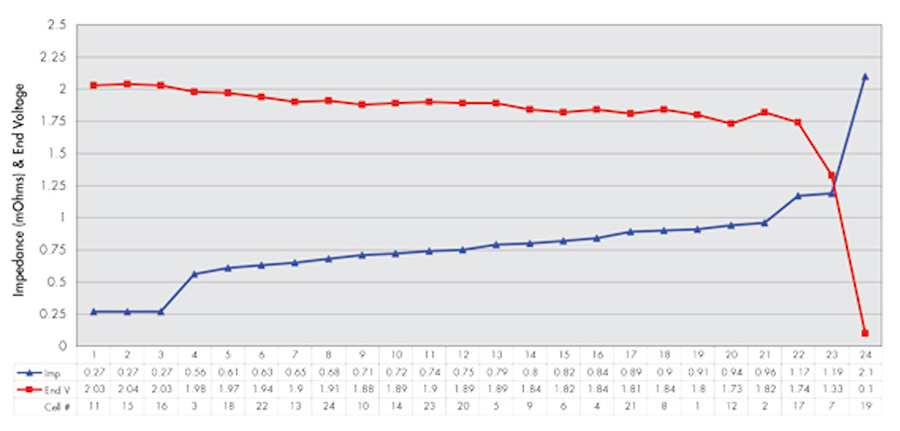
Ohmic testing, a relative assessment, compares current measurements to previous values or baselines to determine the battery’s state of health (SOH). When analyzing data, voltage examination is critical, with tolerances typically within 1% of manufacturer-specified float voltages. Ohmic values can be analyzed through percent variation from the string average, percent deviation from baseline, and changes in inter-cell connection resistance. Key indicators of potential issues (Figure 3) include batteries with 30–50% higher impedance than the string average, multiple batteries showing 30–50% change from baseline (signaling the need for a discharge test), and inter-cell connections with >20% resistance change (requiring torque checks and cleaning).
Discharge/Load Testing
IEEE Std. 1188-2005, IEEE Recommended Practice for Maintenance, Testing, and Replacement of Valve-Regulated Lead-Acid (VRLA) Batteries for Stationary Applications, outlines recommended practices for maintaining, testing, and replacing valve-regulated lead-acid (VRLA) batteries used in stationary applications (Figure 4). Two primary methods for capacity testing are described: the time-adjustment method (recommended for tests lasting over an hour) and the rate-adjustment method (for tests under an hour). Once a method is selected, it should be consistently used for all subsequent tests.

The time-adjustment method adjusts for temperature after testing and is preferred for acceptance and performance tests. Capacity is calculated using the actual test time, rated time, and temperature correction factor (KT). For tests using the rate-adjustment method, which suits shorter durations, the discharge rate may be adjusted for aging or kept at the full published rate. Temperature adjustments (using KC factors) ensure accurate capacity calculation.
Acceptance and Performance Tests
These tests require proper setup, maintaining discharge rates, monitoring cell voltages, and ensuring safety during weak cell bypassing. A service test simulates real-life duty cycles to verify battery adequacy. Batteries should be replaced when capacity falls below 80% of the manufacturer’s rating, or if physical or performance characteristics indicate deterioration. Post-test procedures include restoring normal operations and safely recharging the system.
EMERGING DIAGNOSTIC TECHNIQUES
Electrochemical Impedance Spectroscopy
Electrochemical impedance spectroscopy (EIS)is a powerful diagnostic tool used to measure the impedance, or resistance, within a battery. Impedance measures a circuit’s resistance to alternating current flow, varying with frequency unlike DC resistance. In EIS, the potentiostatic mode applies a voltage and measures the resulting current, while the galvanostatic mode does the opposite. The applied signal (E(t) or i(t)) and the response are phase-shifted and sinusoidal. Regardless of whether sinusoidal voltage E(t) is applied and current response I(t) is measured or vice versa, the response is phase-shifted relative to the input signal. Using complex notation and Euler’s formula, impedance is expressed as:
Z = /Z/ ejϕ= Zr + jZi
where:
- Z = Total complex impedance
- /Z/ = Magnitude of the impedance.
- ejϕ is Euler’s formula representing the phase shift (in radians)
where:
j = Imaginary unit
ϕ = Phase angle
- Zr + jZi is the rectangular form of the same complex impedance.
where:
Zr = Real part (in phase) of the impedance (resistive component)
Zi = Imaginary part (out of phase) of the impedance (reactive component)
EIS experiments typically yield data including frequency, real and imaginary impedance components, magnitude, and phase angle. It assesses battery health by modeling the battery as a circuit with known elements and applying an AC signal across various frequencies to measure impedance response. This technique reveals information about electrochemical double-layer capacitance, charge transfer resistance, solution resistance, and diffusion processes. By analyzing changes in these parameters over time, EIS can detect electrode aging, electrolyte degradation, formation of solid-electrolyte interphase (SEI) layers, and changes in ion transport properties.
EIS data, typically presented as Nyquist or Bode plots (Figure 5), enables non-invasive, real-time monitoring of battery state of health (SOH) and can predict remaining useful life without complete knowledge of past operating conditions.

Ultrasonic Tomography
Ultrasonic tomography is an advanced non-destructive testing (NDT) technique increasingly used for battery diagnostics, particularly in lithium-ion batteries. By transmitting high-frequency ultrasonic waves through a battery and analyzing how these waves are reflected or transmitted, researchers can create tomographic images that reveal the internal structure and condition of the cell.
Ultrasonic tomography involves placing transducers on or near the battery. These devices emit ultrasonic pulses (typically in the 0.1–15 MHz range) into the battery. As the waves encounter changes in material density, such as interfaces, defects, or gas pockets, part of the wave is reflected or altered in speed and amplitude. By collecting and analyzing these signals from multiple angles, it is possible to reconstruct detailed images of the battery’s internal features, much like a medical CT scan.
Applications for Battery Testing
- Defect detection. Ultrasonic tomography can identify local microscopic defects such as metal impurities, voids, or dendrite formation, which are often invisible to electrical testing methods. Detecting these flaws early helps prevent catastrophic failures like internal short circuits or thermal runaway.
- State-of-Health (SoH) and state-of-charge (SoC) monitoring. Changes in the acoustic properties of battery materials correlate with aging, degradation, and charge level. Ultrasonic data can be used to derive quantitative indicators of SoH and SoC, offering more accurate and real-time monitoring compared to traditional voltage or current-based methods.
- Predictive maintenance. Real-time ultrasonic monitoring enables proactive maintenance and enhances battery safety by providing early warnings of degradation or failure risks.
- Quality control. During manufacturing, ultrasonic tomography can be used to ensure internal consistency and detect manufacturing defects before batteries are shipped.
Future Potential
Ultrasonic tomography (Figure 6) offers a powerful, non-invasive method to enhance battery safety, reliability, and performance throughout the battery lifecycle. Advancements in transducer technology, signal processing, and machine learning are expected to further improve the accuracy and accessibility of ultrasonic tomography for battery diagnostics. Portable, cost-effective systems could soon enable widespread use in electric vehicles, grid storage, and consumer electronics.

Active Thermography
Active thermography is an advanced non-destructive testing (NDT) technique increasingly used in battery diagnostics, offering precise defect detection without compromising battery integrity. By applying a controlled thermal pulse — such as a flash of light or brief electrical excitation — and capturing the resulting heat diffusion with high-resolution infrared cameras, engineers can identify internal defects like delamination, voids, misaligned electrodes, weld inconsistencies, and early-stage internal shorts.
Unlike traditional inspection methods, active thermography visualizes hidden flaws by detecting localized anomalies in heat flow (Figure 7), making it suitable across all battery chemistries, including lithium-ion, LFP, solid-state, and nickel-metal hydride. In real-world applications, it plays a crucial role in R&D for design validation, in-line production testing for quality control, and module assembly checks to ensure uniform thermal behavior across cells. After installation, particularly in electric vehicles (EVs), energy storage systems (ESS), or backup power banks, active thermography serves as a predictive maintenance tool. Field technicians can use portable thermography units to monitor battery packs during operation, identifying subtle temperature anomalies that may indicate gas formation, separator degradation, or cell imbalance, long before failure symptoms appear in voltage or impedance. This allows operators to proactively isolate faulty units, prevent thermal runaway, and extend system life.

Applications for Battery Testing
For instance, EV fleet managers can incorporate routine thermal scans into service schedules to detect deteriorating cells, ensuring passenger safety and minimizing unplanned downtime. With its fast, contactless, and scalable nature, active thermography is proving to be an essential tool not just in manufacturing but throughout the operational life of modern battery systems.
Predictive Modeling
Predictive modeling is revolutionizing battery diagnostics by transforming raw building management system (BMS) data into actionable insights across electric vehicles (EVs), energy storage systems, and industrial backup applications. By applying machine learning algorithms, such as random forests, linear regression, and long short-term memory (LSTM) neural networks, to real-time data like voltage, current, temperature, and charge/discharge cycles, predictive models can accurately estimate SoC, SOH, internal resistance, and aging rates.
Unlike traditional threshold-based diagnostics, these models recognize subtle patterns and forecast failures before they occur. A real-time example comes from a major EV manufacturer that deployed predictive analytics in its vehicle fleet: By continuously analyzing battery temperature rise during fast charging, the model flagged early signs of lithium plating in specific cells. Technicians were alerted through the fleet management platform, enabling preemptive cooling system adjustments and selective cell replacement, thereby avoiding expensive pack failures and recalls.
Similarly, in a utility-scale battery storage site, predictive modeling identified a cluster of modules with abnormal voltage decay during partial load cycles, prompting preventative maintenance weeks before alarms were triggered. After installation, these models continue learning and adjusting to operational conditions, detecting degradation under thermal stress, abuse cycles, or grid fluctuation.
Integrated with cloud platforms and digital twins, predictive modeling improves system-wide visibility, offers explainable diagnostics, and enables scalable anomaly detection across thousands of deployed assets. Ultimately, battery testing evolves from reactive checks to intelligent, real-time health monitoring, reducing downtime, enhancing safety, and extending asset life across all modern battery-dependent technologies.
Predictive modeling may be hindered by poor data quality, limited sensor coverage, model overfitting, lack of standardization, high computational demand, and difficulty adapting to new battery chemistries or unknown failure modes.
CONCLUSION
Traditional testing methods such as impedance testing, ohmic measurements, and standardized discharge tests have long served as the foundation for assessing battery state-of-health and performance consistency. These techniques, while essential, are increasingly being supplemented by more advanced diagnostic tools.
Emerging technologies such as active thermography, electrochemical impedance spectroscopy (EIS), and ultrasonic tomography enable non-invasive, real-time insights into internal battery conditions, detecting early signs of degradation, material defects, or impending failures before they impact system performance.
Furthermore, predictive modeling powered by machine learning represents a paradigm shift in battery diagnostics. By analyzing real-time BMS data streams, predictive models can forecast failures, track aging, and recommend maintenance actions well before traditional metrics indicate issues. Such capabilities are essential not only for extending battery life but also for reducing downtime, avoiding catastrophic failures, and optimizing asset utilization across electric vehicles, grid storage, and critical infrastructure.
REFERENCES
- IEEE. IEEE Std. 450-2020, IEEE Recommended Practice for Maintenance, Testing, and Replacement of Vented Lead-Acid Batteries for Stationary Applications.
- IEEE. IEEE Std. 1188-2005, IEEE Recommended Practice for Maintenance, Testing, and Replacement of Valve-Regulated Lead-Acid (VRLA) Batteries for Stationary Applications.
- IEEE. IEEE Std. 1106-2015, IEEE Recommended Practice for Installation, Maintenance, Testing, and Replacement of Vented Nickel-Cadmium Batteries for Stationary Applications.
- IRENA (2017). Renewable Energy Statistics 2017, The International Renewable Energy Agency, Abu Dhabi. Access: https://www.irena.org/-/media/Files/IRENA/Agency/Publication/2017/Jul/IRENA_Renewable_Energy_Statistics_2017.pdf.
- Paul Gasper, Andrew Schiek, Kandler Smith, Yuta Shimonishi, Shuhei Yoshida. “Predicting Battery Capacity from Impedance at Varying Temperature and State of Charge Using Machine Learning,” Cell Reports Physical Science, Vol. 3, Issue 12, 101184, December 21, 2022. Access: https://docs.nrel.gov/docs/fy23osti/82892.pdf.
- Battery Life. Battery Diagnosis Testing. Access: https://batterylife.co.nz/forklift-battery-and-marine-battery-testing-and-diagnosis.php.
- Yankai Cao, Seong Beom Lee, Venkat Subramanian, Victor M. Zavala. “Multiscale Model Predictive Control of Battery Systems for Frequency Regulation Markets Using Physics-Based Models,” Journal of Process Control, November 2019, pp 46–55. DOI:10.1016/j.jprocont.2020.04.001.

Swapnil Marathe is an Electrical Engineer with Megger, where he began as an intern to support protection and control, and moved to substation testing. His current area of focus is testing transformers, batteries, and circuit breakers. Marathe earned a Major in EE from the University of Texas at Arlington.

Joseph Aguirreis the National Technical Service Manager at Spark Testing. He previously worked as a Principal Engineer at Megger, specializing in cable testing, diagnostics, and fault location techniques, with extensive experience in testing various substation apparatuses. Before joining Megger, Aguirre served in pivotal roles, including maintenance technician, crew foreman for utility substation maintenance/construction, and NETA Technician. He holds a BS in industrial engineering technology from the University of Texas of the Permian Basin and an MBA from Louisiana State University.