

The goal of any good power system is simple in theory: Deliver clean power to the loads it serves. In practice, however, “clean” quickly becomes a relative term. Spend enough time around power quality measurements, and one thing becomes apparent: Many of the disturbances blamed on incoming utility power originate inside the facility itself. Wiring practices, grounding methods, and interconnected loads are often larger contributors to so-called dirty power than disturbances arriving from outside the meter.
Put another way, dirty power is often in the eye of the load. The issue is less the absolute condition of the supply than the susceptibility of the equipment connected to it.
Modern electrical systems complicate this further. Electronic loads have become smaller, denser, and more sensitive to voltage disturbances, while also injecting more distortion back into the system. Manufacturers compensate with increasingly sophisticated protective circuitry, but those protections are limited by cost, spacing, and thermal design. The result is a power environment where the system intended to support critical loads can become surprisingly hostile to them.
Alongside the evolution of electrical systems, power quality analyzers (PQAs) have become exceptionally capable instruments, combining rapid sampling, harmonic analysis of waveforms, event triggering, and reporting into a single platform. Yet even sophisticated analyzers are only as useful as their configuration. Understanding the ABCs of power quality analysis—anatomy, benchmarking, and capture—provides the framework for configuring the instrument to answer the diagnostic question being asked.
A IS FOR ANATOMY: THE ELECTRICAL SYSTEM AND WHERE TO MONITOR
If you frequent this publication, we do not need to explain the basic anatomy of an electrical system. What is worth examining is where the instrument should be placed within the system, because it is one of the most common misunderstandings about working with PQAs in complex systems. The right answer depends on the question being asked, and the wrong choice of location will limit even the most sophisticated analyzer to missed events or misleading data.
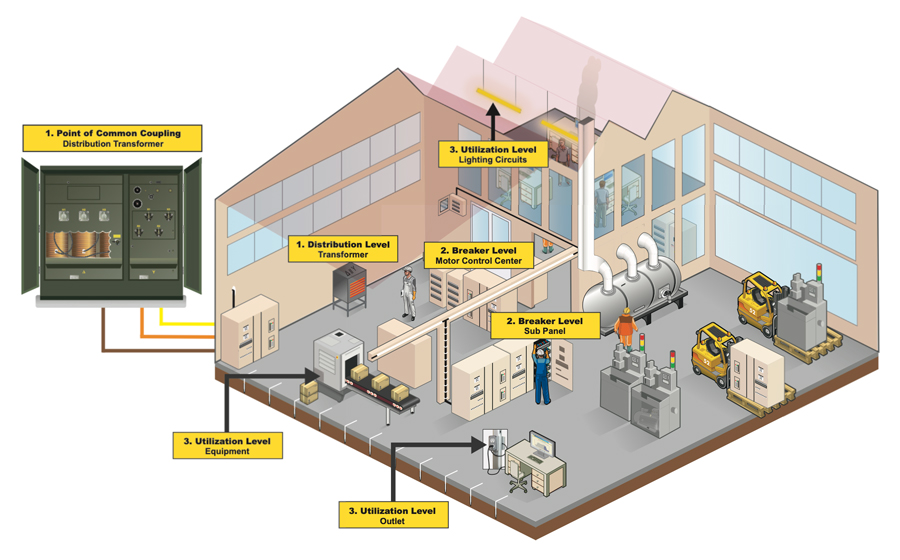
Figure 1 shows the three monitoring levels in a typical facility, from the utility-side distribution transformer down to the outlets, lighting, and equipment that ultimately consume the power.
Point of Common Coupling
The point of common coupling (PCC), sometimes called the service level, is the derived source of power for the facility, typically the secondary of a distribution transformer. Studies at this level capture the entirety of the local electrical network, making it valuable for understanding overall system performance and the facility’s interaction with the utility. It is less effective for locating specific internal sources because the contributions of individual loads have already aggregated by the time current and voltage reach the PCC. The PCC is also where the utility’s power quality requirements formally apply. Service agreements and tariffs commonly hold the customer to harmonic distortion, flicker, and power factor limits measured at this point, and any question of responsibility for a disturbance is ultimately settled with data recorded here.
Most preset configurations in PQAs are designed against PCC-level references, especially the harmonic compliance limits in IEEE Std. 519, Standard for Harmonic Control in Electric Power Systems. The resulting data has value for documenting overall system behavior and for any conversation with the utility, but it is not the optimal starting place when the goal is to locate an internal load behaving badly.
Breaker Level
A study at the breaker level, such as a sub-panel or a motor control center, is better suited to locating circuit-level issues than studying at the PCC. Monitoring here focuses primarily on voltage stability across the branch circuits the panel serves and can reveal patterns spanning multiple loads that would be invisible at any single piece of equipment.
Consider a retrofitted LED lighting system. Before the upgrade, fluorescent tubes failed on a typical maintenance cycle, but new LED fixtures are failing much sooner than their expected end of life. A study at the panel feeding the lighting circuit may reveal overvoltage issues causing LED driver failure, the kind of marginal voltage variations older fluorescent tubes were largely immune to.
Utilization Level
Utilization-level studies have the most diagnostic impact when only a single load is exhibiting problems. Consider a recently upgraded high-speed printer that begins to misoperate shortly after installation (Figure 2). This is exactly the kind of problem a utilization-level study is designed to resolve. Despite being the easiest of the three monitoring tiers to deploy, utilization-level studies are also among the most consistently underused. Monitoring directly at the equipment terminals establishes the actual electrical environment experienced by the load, including voltage variations that may remain well inside published standards yet still exceed the susceptibility of the connected equipment.
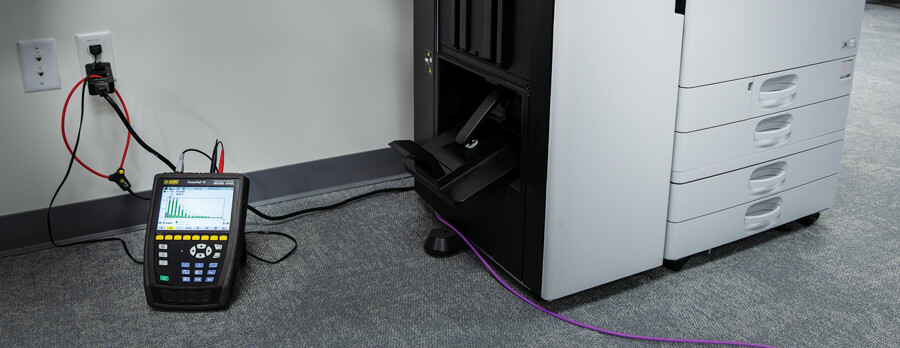
Figure 2: Single-Phase Outlet Power Quality Analysis
Cascading Studies
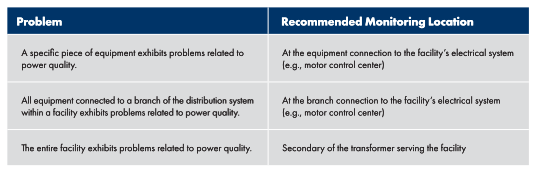
One PQA is useful in identifying issues at one level. Several PQAs, deployed simultaneously at different tiers and synchronized in time, tell an entire power disturbance story. Class A instruments include accurate time synchronization, which makes it possible to capture events at multiple monitoring points and analyze them after the fact against a common timeline. Comparing what a single disturbance looked like at the PCC, at a sub-panel, and at the affected load is one of the few ways to determine with confidence whether a problem is being delivered from upstream or generated by something inside the facility. IEEE Std. 1159–2019 formalizes this same monitoring approach by relating the problem scope to the monitoring location, as summarized in Figure 3.
B IS FOR BENCHMARKING: CONFIGURING THRESHOLDS FOR THE LOADS BEING SERVED
With the analyzer placed at the right monitoring level, selecting the thresholds to monitor on recorded parameters is the next step. Every parameter a PQA records includes configurable thresholds that determine which events get flagged and which pass unrecorded. Setting those thresholds against published voltage standards alone, such as ANSI C84.1, IEEE Std. 519, or EN 50160 in the European context, can be misleading. Compliance with a published voltage standard does not guarantee a problem-free electrical environment for sensitive loads.
Benchmark Studies
Before configuring a long-form study, one of the most useful steps is establishing a short benchmark recording under normal operating conditions. The goal is not to capture power-related events but to characterize what normal operation looks like at the monitoring location. Capture minimum, maximum, and average RMS voltage per phase, along with RMS current, frequency, and harmonic content, including THD and individual harmonic components where relevant. Cross-reference the recorded trends with operational logs, misoperation reports, or operator observations. The resulting operating envelope becomes the basis for configuring alarm thresholds in the long-form study that follows. See Figure 4 for an example.

The benefit of starting with a benchmark study is that it tunes the analyzers’ capture to the local environment. A workstation that resets every few hours may be reacting to voltage deviations well inside the published utilization range, which does not trigger the analyzer’s default 10% sag threshold. A benchmark study captures the actual operating voltage envelope—perhaps 117 V to 122 V during normal hours—and lets the technician set a sag alarm just outside that envelope, say 115 V, rather than at the default threshold the load would never have hit.
Benchmarking Versus Standards
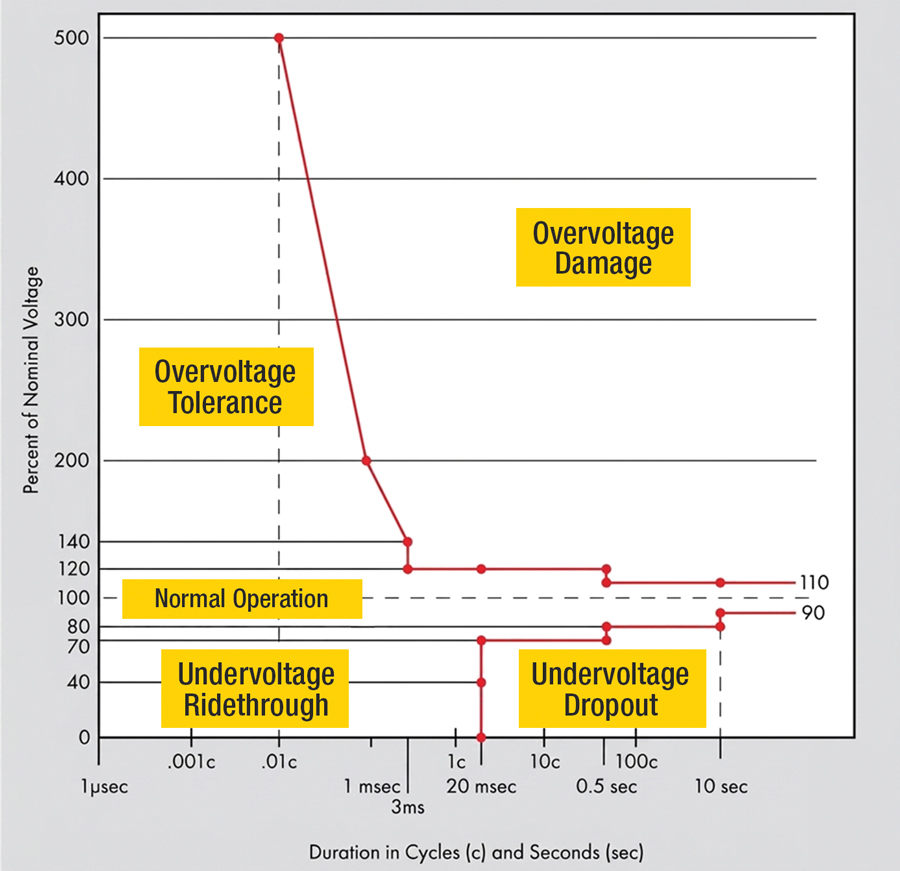
Most PQAs ship with templates configured against standards such as ANSI C84.1, IEEE Std. 519, or EN 50160. These standards are useful starting points for general power quality assessment, but they are not the right benchmark when the question is whether a specific sensitive load is being treated badly. For that question, load susceptibility—meaning the actual tolerance of the connected equipment—is the critical benchmark. The Information Technology Industry Council (ITIC) curve, shown in Figure 5, is one widely used susceptibility reference for IT-class equipment. It defines a voltage-versus-time envelope inside which IT-class equipment is expected to ride through without dropout or damage. Equipment manufacturer specifications can be tighter still, and a sensitive load may operate within a window narrower than ITIC predicts.
Parameter Selection
A modern PQA can offer more than 200 selectable parameters in its trend and alarm modes, but capturing every available parameter often produces large reports and junk data rather than diagnostic insight. The temptation is strongest with the long list of calculated power quantities that advanced instruments provide. Values like non-active power, distortion power, and other specialized decompositions of apparent power can be useful in dedicated engineering analysis, but they rarely contribute meaningfully to routine troubleshooting work. They also consume storage and analyst attention that could be better spent elsewhere.
For a basic study, focus on the voltage side. Voltage RMS minimum, maximum, and average per phase, along with voltage THD, will surface most of the disturbances a technician is investigating. Current parameters are worth capturing for specific cases, such as current balance studies or inrush analysis. Defaulting to full current capture across every long-form study tends to inflate data files without adding diagnostic value, because most power quality disturbances are voltage events.
Harmonic Monitoring
Harmonic content (Figure 6) is one of the parameters most likely to produce confusion when analyzer thresholds are configured without considering where the instrument is installed. Preset templates and default analyzer configurations often work well for general voltage monitoring, but harmonic thresholds may not behave the way the user expects.
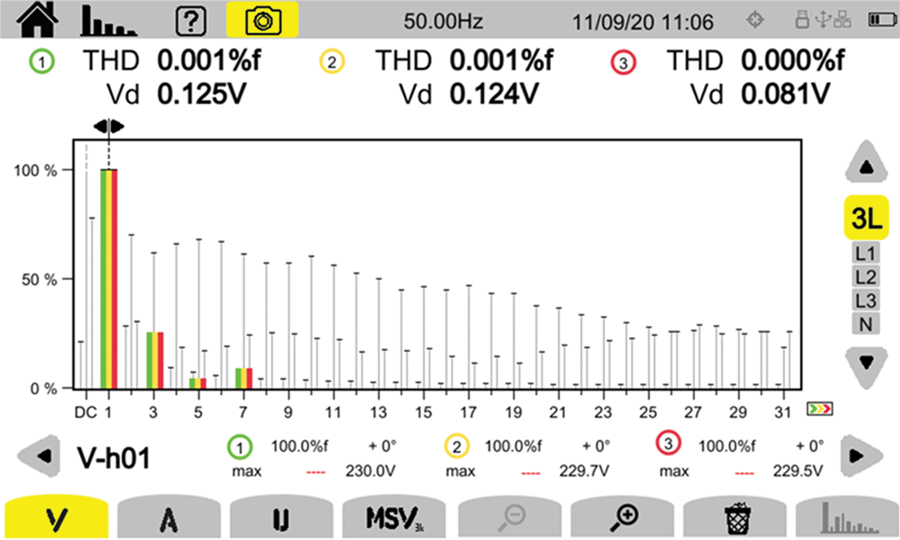
At the utilization level—close to a nonlinear load such as a VFD, switch-mode power supply, rectifier, or LED driver—current THD of 20% to 40% may be completely routine depending on the topology and measurement location. At the PCC, however, IEEE Std. 519-2022 recommends limiting voltage THD to 8% for systems at or below 1 kV, with individual harmonics limited to 5.0%. Both conditions can be correct because they describe different measurement locations within the system.
Harmonic currents generated by nonlinear loads dilute and partially cancel as they aggregate upstream and mix with other loads. As a result, thresholds appropriate at the PCC can produce nuisance alarms when applied at the utilization level. Benchmark studies and equipment specifications provide a more realistic basis for configuring harmonic alarm thresholds near sensitive or nonlinear loads.
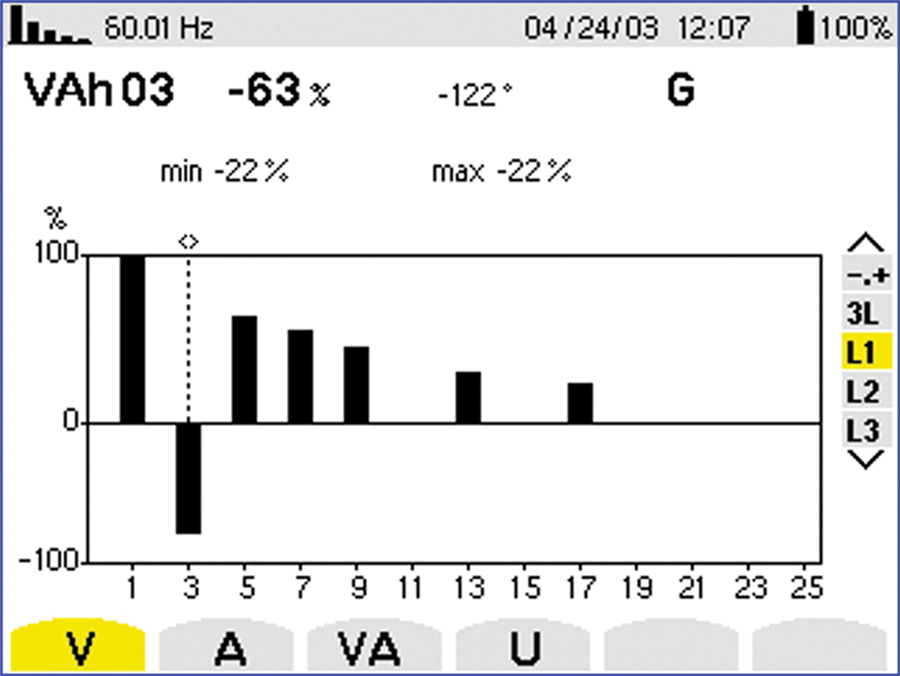
Harmonic flow analysis (Figure 7) can further help identify the source of a problematic harmonic. Modern analyzers capable of synchronous voltage and current sampling can calculate harmonic power flow by harmonic order. Positive harmonic power flow indicates the downstream load is injecting the harmonic, while negative flow indicates the harmonic is arriving from upstream. This technique is particularly useful when determining whether harmonic distortion originates inside the facility or from an external source.
Neutral-to-Ground Voltage as a Threshold
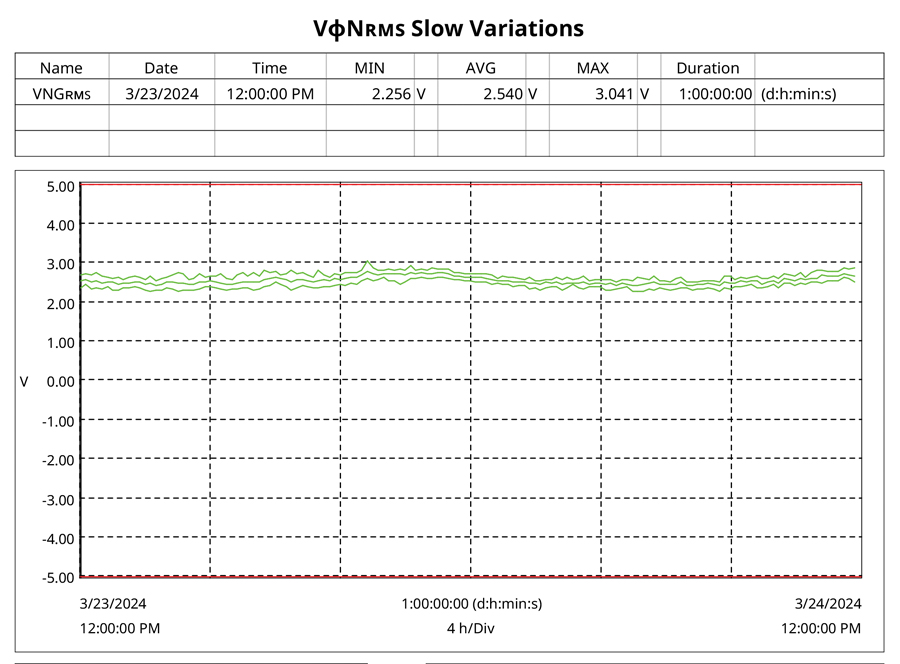
The voltage between neutral and ground should sit near zero on a properly bonded system. Figure 8 shows a sustained neutral-to-ground voltage of approximately 2.5 to 3 V over a 24-hour period. While the system may appear electrically stable from a conventional voltage perspective, elevated neutral-to-ground voltage can indicate an unstable local reference environment for sensitive electronic or communication equipment. Conditions like these are commonly associated with harmonic-rich neutral currents, shared neutrals, or bonding issues and may create problems even when line voltage remains within published standards. IEEE Std. 1100 suggests keeping neutral-to-ground voltage below 1 V at receptacles serving sensitive loads, with tighter thresholds (under 100 mV) for some medical and information-technology installations.
C IS FOR CAPTURE: RECORDING THE DATA THAT ANSWERS THE QUESTION
With the analyzer placed at the correct monitoring level and thresholds established through benchmarking, the work shifts to capturing and verifying the presence of power-quality events. The analyzers’ capture configuration—whether continuously, on triggered events, or in some combination—determines what kind of reporting and analysis is possible when the study is complete.
Capture Modes
Modern PQAs offer four broad capture modes, and choosing the right one is one of the more consequential configuration decisions a technician makes.
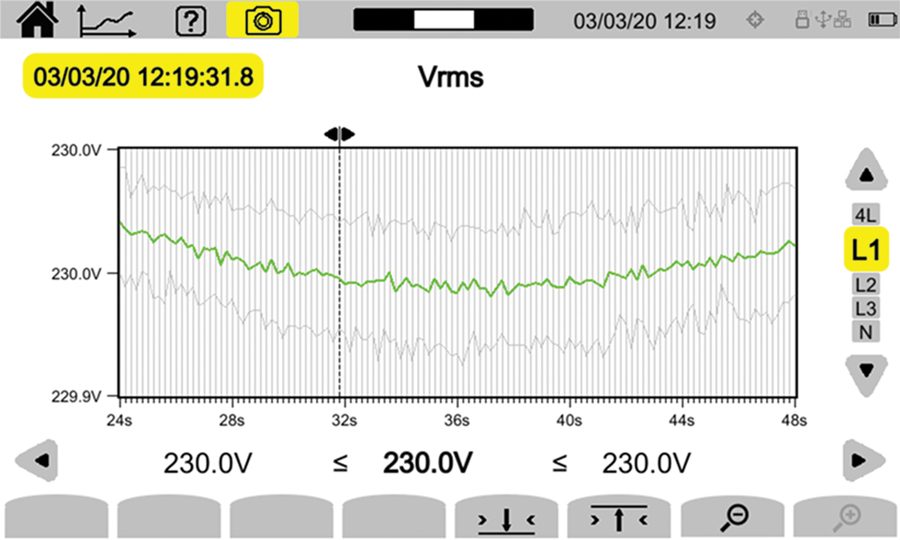
Trend mode–type studies (Figure 9) record continuously over a user-defined aggregation interval and are most useful for benchmark studies or long-term operating contexts. Because it records every aggregated value over time, analysis often involves hunting and pecking through large datasets, which makes trend mode better suited to baseline characterization than to event-focused troubleshooting.
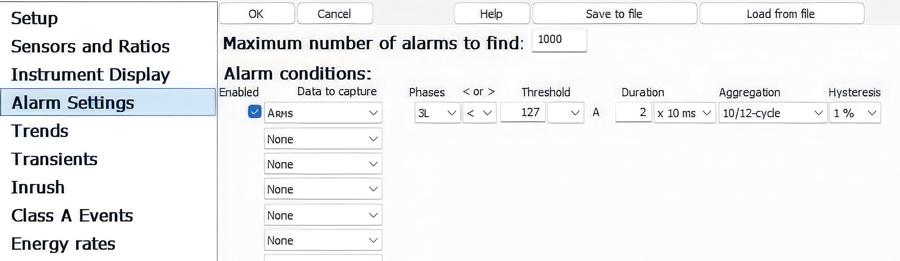
Alarm mode (Figure 10) builds on the same trend-recording structure but captures only events that exceed configured thresholds. Instead of producing a continuous operating record, alarm mode generates a smaller, more focused dataset centered on the events of interest.
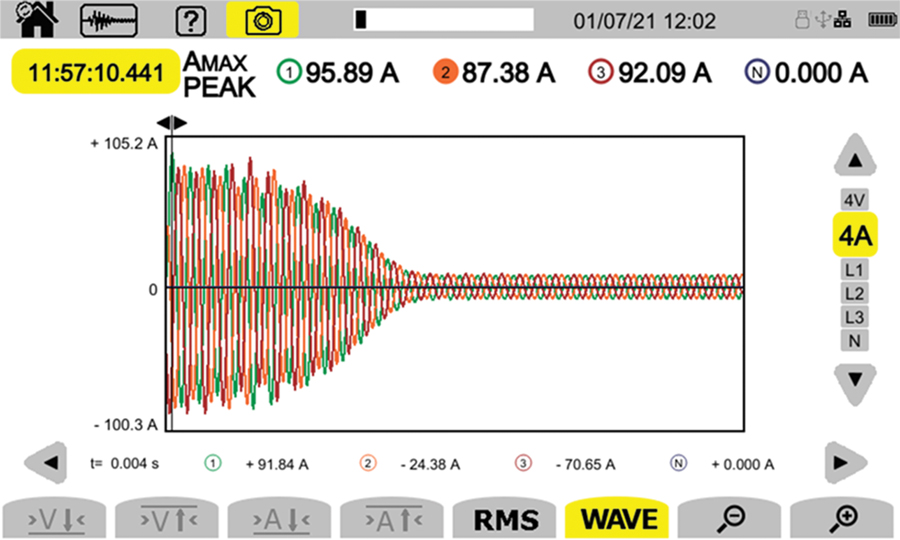
Transient and inrush modes (Figure 11) are specialized waveform-capture variants of alarm mode. Both trigger from configurable thresholds but record high-resolution waveforms rather than aggregated RMS values. Transient mode is intended for fast events such as switching surges, while inrush mode captures motor or transformer energization.
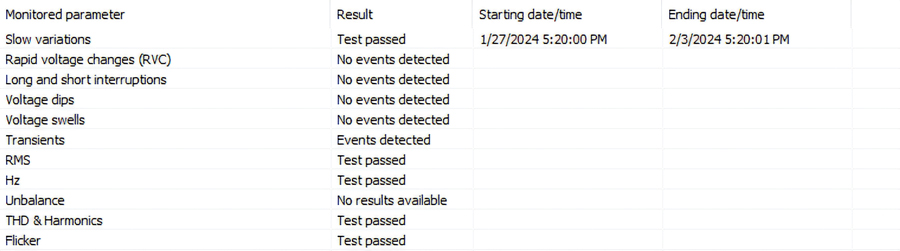
In practice, most PQAs include pre-configured monitoring studies (Figure 12) that combine trend-mode continuous recording with alarm- and transient-modes operating in parallel to trigger specific events. The trend record provides continuous context, while the alarm, transient, and inrush triggers capture the specific moments that matter at higher resolution. Typically, these monitoring studies are run at the PCC for voltage quality standards, utilizing various standards, but can be adjusted to monitor power quality at breaker and utilization levels.
RMS Aggregation Intervals
Aggregation intervals determine the resolution at which the analyzer summarizes RMS values for the trend record and alarm capture, and choosing the right interval is a tradeoff between resolution and data manageability.
Long aggregation periods, such as 15-minute windows, smooth the data and are ideal for demand studies, load profiling, and long-term trend work where the relevant question is about system behavior over hours or days. Short aggregation periods, such as 1-second or 12-cycle (approximately 200-ms) intervals, give significantly higher resolution.
The captured data at these intervals can be meaningfully compared with the multi-cycle portion of susceptibility references, such as the ITIC curve, manufacturer specifications, or other narrow-window equipment tolerances. A 10-minute aggregation will smooth out a 200-ms voltage sag from the data. A 12-cycle aggregation will register that same sag as a measurable RMS deviation.
For voltage changes that happen faster than the aggregation window can resolve, rapid voltage change (RVC) capture provides a complementary high-resolution method. As defined in IEC 61000-4-30, RVC uses sub-cycle RMS calculations to flag fast voltage shifts that may not exceed the sag or swell thresholds yet still indicate a meaningful disturbance. This bridges the gap between the standard aggregation intervals and the analyzer’s waveform-capture modes.
Study Duration
The right length for a power quality study is dictated by the timing of the event being investigated. Before setting the analyzer to record, it is worth asking a few diagnostic questions about the symptom: How often does the event occur? Where does it occur? What equipment is being affected? Is the timing correlated with temperature, weather, or a production schedule?
The answers shape how long the study needs to run and when it should run:
- Benchmark studies, as discussed earlier, are short by design and run from 1 hour to 24 hours to characterize normal operation.
- The long-form power quality study that follows ranges from a day to several weeks, depending on the event timing.
- An event recurring every shift may surface within a single day.
- An event tied to weekly production cycles needs at least a week.
- An event correlated with seasonal weather or temperature variation may require a study spanning the relevant conditions, sometimes a month or more.
There is little value in running a long-form study during scheduled downtime, planned outages, or any period when the loads of interest are not operating. The analyzer captures the absence of the problem, not its cause. When in doubt, leave the meter longer, but leave it in place during the conditions when the symptoms actually appear.
Class A and Class S
A brief note on measurement class: IEC 61000-4-30 defines Class A as the reference measurement class, with the tightest specifications on accuracy and time synchronization. Class S is the survey class, which uses the same measurement methods but with looser uncertainty requirements. Most PQ work is well-served by Class S Instruments. The exception is when measurement data may be challenged or used for formal compliance reporting, in which case Class A is the appropriate choice.
FROM DEFAULTS TO DIAGNOSIS
A PQA is a sophisticated diagnostic instrument, but the bulk of its diagnostic value is unlocked by configuration choices made at deployment:
- Anatomy answers the first question: where to monitor. The right monitoring tier depends on whether the problem is at a single piece of equipment, across a branch circuit, or facility-wide.
- Benchmarking answers the second question: what to flag. Thresholds informed by a shorter initial study and matched to the susceptibility of the onsite load produce alarm logs that point to the problem rather than to the noise floor.
- Capture answers the third question: how to record the data. Capture modes, aggregation intervals, and the disciplined use of RMS trends over waveform snapshots determine whether the recorded data answers the question the technician asked.
The configuration that follows from these three questions looks different from the preset templates PQAs ship with. That is the point. Default settings are starting positions, not landing points. The high-speed printer, the retrofitted LED lighting circuit, and the factory facility’s interaction with the utility all present different questions, and each requires a PQA configured to answer the specific question at hand. Power quality work begins, and continues, at the most sensitive load. The analyzer’s job is to capture the evidence. Configuration is what makes the evidence useful in diagnosing power quality issues.
These measurements do not require exotic instrumentation or a specialist’s toolkit. It requires a technician who treats a PQA as an extension of the diagnostic questions already being asked: where the symptom lives in the facility’s anatomy, what “normal” looks like at that location, and which capture settings will preserve the evidence when the event finally occurs. Approached this way, the ABCs of the PQA turn a box of default settings into a targeted diagnostic instrument and turn weeks of recorded data into a handful of records that explain why the printer locks up, the lighting flickers, or the drive trips. That is the difference between collecting data and finding the problem.

Gregg Wong is a Product Manager and technical training professional with AEMC Instruments, specializing in electrical test and measurement applications. He holds a degree in electrical engineering technology and is an AEMC Instruments Certified Technical Trainer, with experience spanning field service, sales engineering, product training, and technical content development. His areas of expertise include ground resistance testing, insulation resistance testing, power quality analysis, and the practical application of electrical testing standards.