
The sweep frequency response analysis (SFRA) test is a powerful and sensitive method for assessing the mechanical and electrical integrity of a transformer core/coil assembly. SFRA includes two tests: an open test and a short-circuit test. Both test a complex network of inductances, capacitances, and resistors, and frequently successfully detect the presence of an electrical failure, including a shorted turn.
Since windings are electromagnetically coupled, the SFRA trace obtained from one winding may be affected by an electrical fault in another winding. Identifying which winding has the problem is challenging. This article describes the experience with four units in which the faulty winding was identified by employing the inductive interwinding SFRA setup, referred to here as the SFRA ratio test.
INTRODUCTION
The objective of the traditional voltage ratio test is to verify the correct number of turns and the internal connections. It serves as a benchmark to assess possible future damage, e.g., shorted turn(s). While theoretically the change in the voltage ratio data should point to the winding with a shorted turn, in practice, the data may not paint a clear picture.
To address this, the inductive interwinding SFRA setup was employed. This setup offers a frequency segment (less than 200 Hz), in which the ratio of the induced voltages is closely proportional to the turns ratio. The direction of the deviation in the aforementioned SFRA trace segment points to the winding that hosts the defect. The following discussion describes the basics of the test along with the results of several field investigations.
BASIC PRINCIPLE
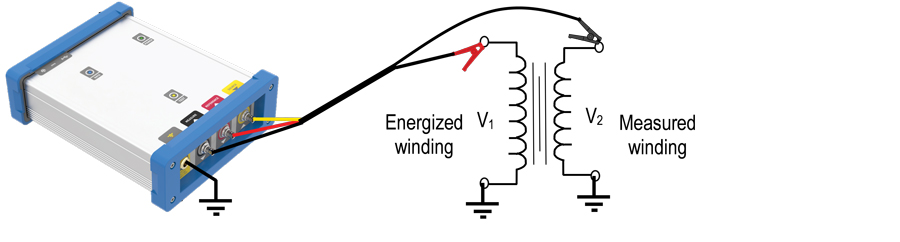
The basic setup of the SFRA ratio test employs connections for the inductive interwinding SFRA test (Figure 1). The high-voltage winding is excited by the test voltage (V1) applied between the red lead and ground, and the secondary voltage (V2) is measured between the black lead and ground.
The expression for the SFRA magnitude in dB is:

From (1), the ratio of voltages is:

The relevant ratio data can only be obtained in the frequency segment where the ratio of voltages corresponds to the ratio of turns. For the units tested, the data were analysed in the frequency segment where the SFRA ratio remained constant, i.e., at frequencies below 200 Hz.
The selection of frequency for SFRA ratio measurement is based on the following criteria:
- The frequency must be in the voltage turn-ratio region (< 200 Hz).
- Avoid the harmonic frequencies of the power system and the integer multipliers.
- The lower the frequency, the lower the influence of the capacitive components on the voltage turns ratio.
Therefore, 38 Hz is the best frequency to meet the above criteria. A different frequency could be selected to read the SFRA ratio in the ratio region, but it could be affected by a power system disturbance.
The spread between the SFRA traces of the various phases can be useful in detecting and confirming the presence and location of the defect (3):

In (3), are the SFRA ratio values obtained from the trace of each phase? To identify which winding has the shorted turn, the trace deviation in the segment below 200 Hz is examined.
The analysis is based on calculating the deviation for a set of three traces using Equation (3). Then, if the 0.5% limit (derived from field data) is violated, the trace that deviates the most from the other two is identified. The assumption is that the defect exists in only one phase.
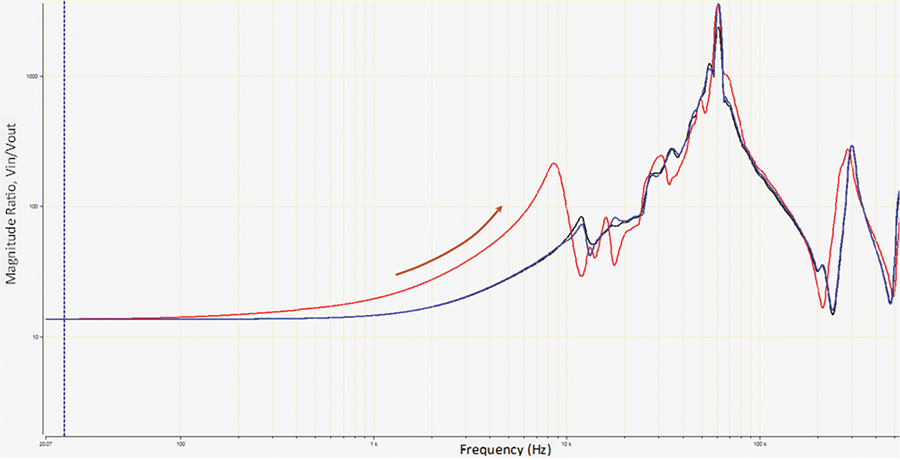
The trace segment will move upward (towards a higher ratio value) if a shorted turn is present in the low-voltage winding, as shown in Unit 2 and Unit 3. The deviation can increase with frequency, resulting in increased deviation at higher frequencies, as shown in Unit 2. This makes the defect more obvious.
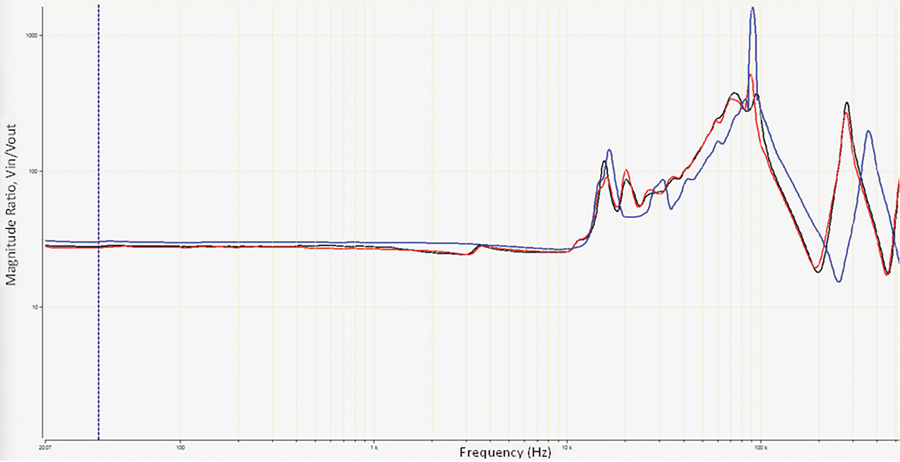
The trace segment will move downward (towards a lower ratio value) if the shorted turn is present in the high-voltage winding, as shown in Unit 4.
To assist the field tester, the rule mentioned above is implemented in the SFRA application that provides two features:
- Graphic results of magnitude (ratio) for direct ratio reading
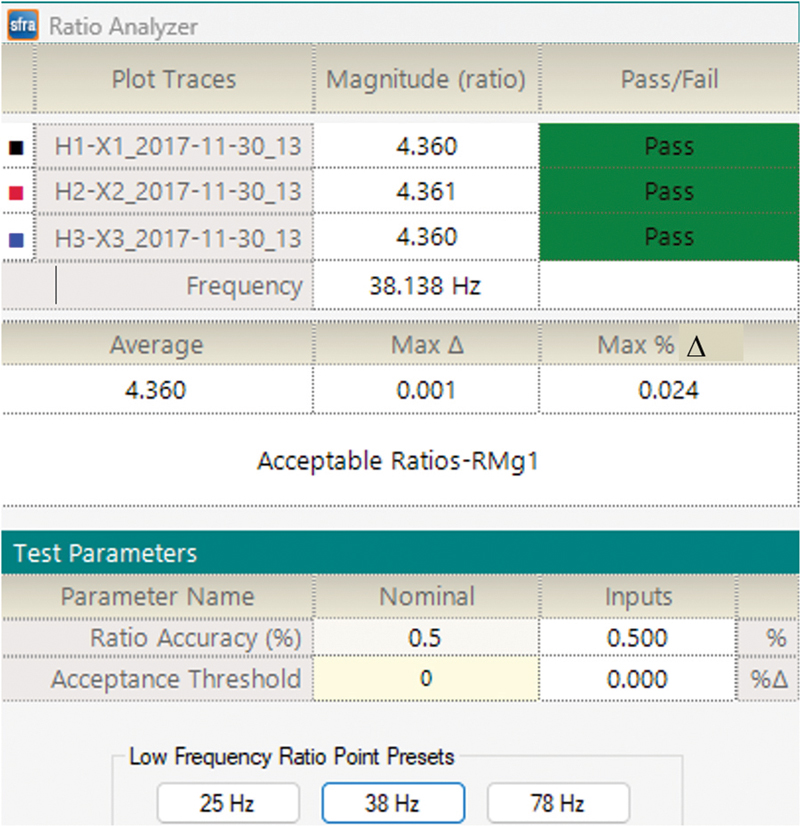
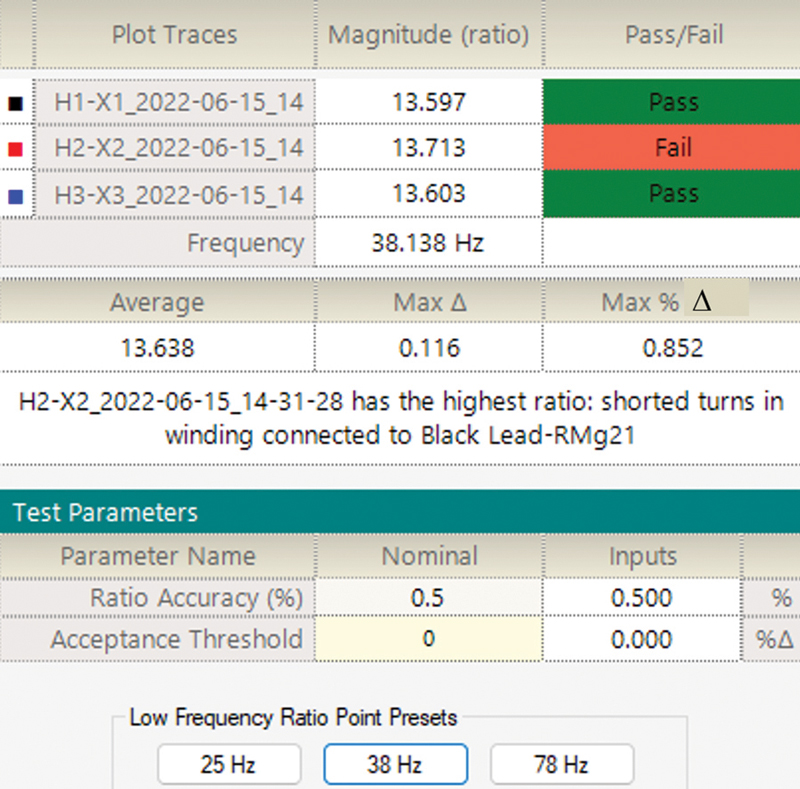
- Ratio analysis of the selected three-phase traces to read the ratio, determine the ratio deviation, and identify the defective phase along with the winding sheltering the shorted turns, as shown in Table 2
CASE STUDY
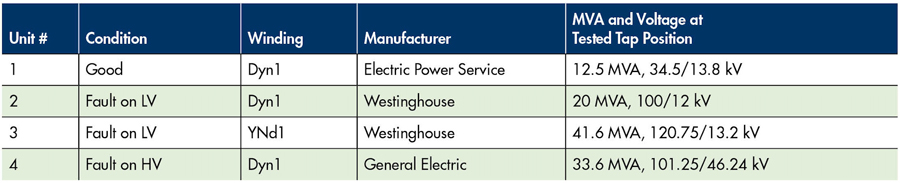
Four transformers were used to demonstrate the SFRA ratio application. The four units have different winding configurations with conditions ranging from good to conditions with a fault in the primary or secondary winding, as summarized in Table 1. The test results are summarized in Figure 2–Figure 5.
DATA REVIEW
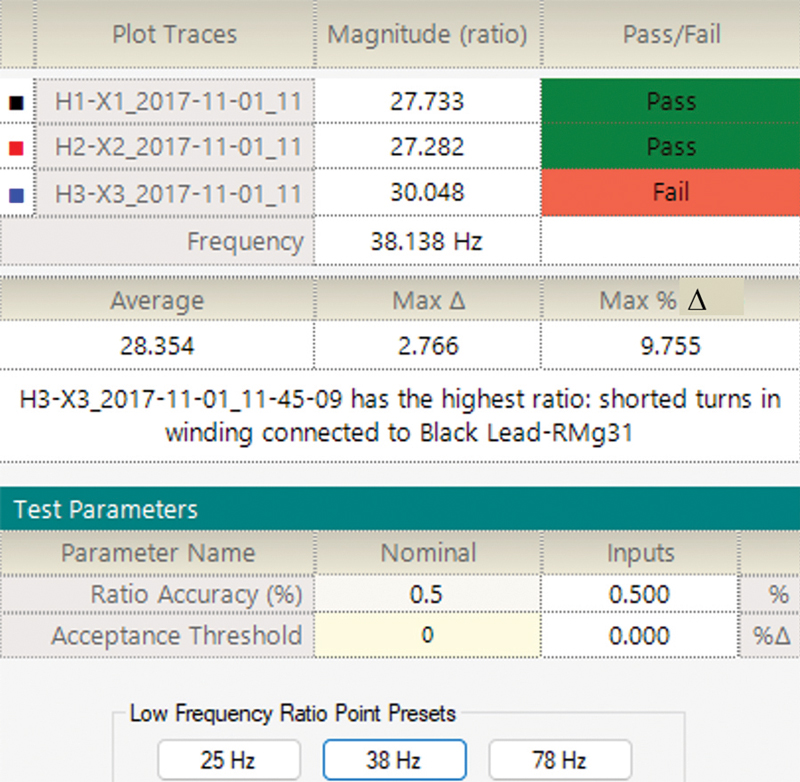
In each figure, the left column displays the graphical results of SFRA Ratio tests, with three selected traces coloured black, red, and blue for phases A, B, and C, respectively. The right column shows the ratio analysis of the three traces. The analysis performs four tasks:
- Measures the ratio values at the selected frequency by the cursor
- Calculates the maximum deviation among the three phase ratios
- Compares the deviation to the 0.5 % limit in the Inputs field
- Rates each phase ratio pass or fail and provides a diagnostic message. If it fails, the results will indicate which winding has the shorted turns in the fail phase.
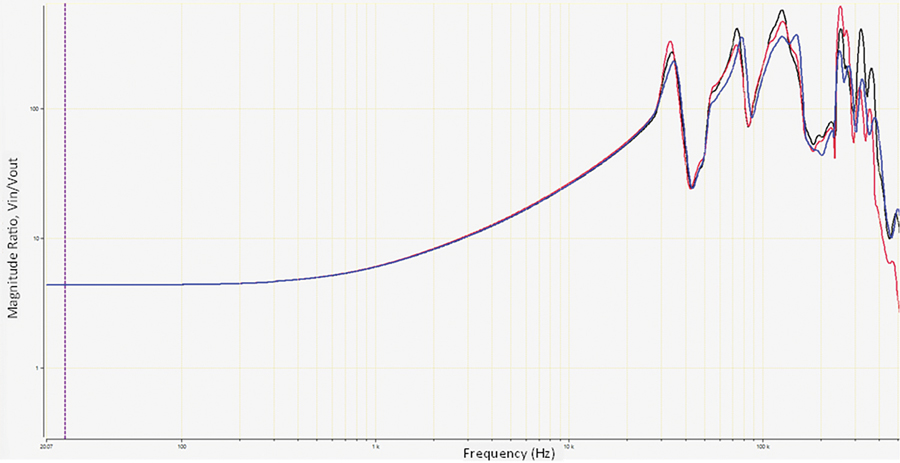
Figure 2a: Unit 1, Dyn1, NP Ratio = 4.33


(Phase B)
CONCLUSION
This case study shows that the SFRA ratio test was successful in both tested transformers. It detected the presence of the shorted turns and identified the winding that was sheltering them.

Long Pong is a Senior Principal Engineer in the Doble Client Service Department. He has amassed over 30 years of experience in power utility and has published numerous technical papers on condition assessment, troubleshooting, and new test techniques for power electrical apparatus. Before joining Doble in 2000, he was employed at Alcan-Énergie Électrique and Hydro-Québec. Pong is an IEEE member and a registered Professional Engineer in North Carolina. He earned a BS in electrical engineering from École Polytechnique de Montréal, Quebec, Canada.