

This article discusses best practices for managing inspection data in electrical utilities, emphasizing the importance of standardized collection, metadata tagging, and compliance with IEEE 1808-2024. It highlights the value of integrating data from multiple sensors, including RGB, thermal, and ultraviolet imaging, with geographic and asset information, and applying structured, industry-based diagnostics. These practices support traceable condition assessments, consistent severity scoring, and risk-informed maintenance planning.
THE CHANGING LANDSCAPE OF GRID INSPECTIONS
The worldwide power grid infrastructure is undergoing significant strain. Aging transmission lines, growing demand, and heightened regulatory expectations converge with environmental stressors, including extreme weather events. Utilities are being asked to deliver improved resilience and reliability while simultaneously optimizing costs and resources.
Traditional inspection practices — visual patrols, thermal scanning, and ultraviolet corona detection — have been integral for decades. Yet these methods have often been fragmented, with data recorded in separate systems, analyzed independently, and interpreted inconsistently across teams. The result is a patchwork of valuable but underutilized information. In an environment where predictive maintenance and regulatory compliance are central, utilities can no longer afford to leave inspection data siloed or subjective.
The move toward standardized, computer-based data management is therefore not optional but essential. Inspection information must be collected in structured ways, combined with contextual metadata, and processed through frameworks that ensure consistency, traceability, and interoperability. Various standards now provide clear frameworks for this transition, defining how inspection data can evolve from disparate reports into a strategic asset for decision-making.
ASSET MANAGEMENT METHODOLOGIES
At the core of utility operations lies asset management: the structured discipline of planning, operating, maintaining, and ultimately retiring infrastructure assets in a way that balances cost, risk, and performance. For power systems in particular, asset management is not just about prolonging equipment life; it directly underpins grid reliability and resilience. Poorly managed assets can lead to cascading failures, widespread outages, and regulatory penalties, whereas well-managed assets contribute to stable operations, optimized capital expenditure, and improved public trust.
The sophistication of asset management practices varies considerably across utilities, often reflecting organizational maturity, regulatory environments, and resource availability. In general, these practices can be viewed as evolving through four progressive stages.
- The most rudimentary stage is reactive replacement, where assets are operated until failure and only then repaired or replaced. This approach is highly unpredictable and expensive. It places operators in a constant firefighting mode, creates risks of collateral damage, and undermines power system reliability because failures occur without warning and may escalate into service interruptions.
- A modest improvement is the lifecycle replacement strategy, which replaces equipment based on a predefined service life. While this approach introduces planning and budget predictability, it often fails to reflect actual asset condition. Components that still have years of useful life may be retired prematurely, while others in harsher environments may fail before their planned replacement, again threatening reliability.
- The third stage, condition-based replacement, integrates inspection and monitoring data into decision-making. Here, equipment is serviced or replaced based on observed degradation, such as hotspots, partial discharges, or mechanical wear. This method reduces unnecessary replacements and helps utilities extend asset life while preventing sudden failures. However, without standardized data collection and interpretation, condition-based practices may still be inconsistent, fragmented, and difficult to scale across large systems.
- The most advanced stage is risk-based asset management, which considers the condition of the equipment but also evaluates the impact of its failure. In this framework, utilities assess not only what is wrong with an asset but also the consequences if it fails. A cracked insulator in a redundant rural feeder may pose little system risk, while the same defect in a critical substation feeding a hospital demands urgent intervention. By combining condition data with contextual information such as redundancy, customer criticality, and regulatory implications, risk-based asset management allows utilities to prioritize resources where they matter most.
BEST PRACTICES FOR ASSET AND INSPECTION DATA MANAGEMENT AND REGULATORY ALIGNMENT
Effective management of inspection data is increasingly recognized as a cornerstone of utility operations. As grids expand and regulatory oversight grows more stringent, utilities are expected to perform inspections and ensure that the resulting data is accurate, structured, and actionable. Best practices in this area encompass the entire data lifecycle, from field collection through validation, analysis, storage, and long-term use in asset management.
- A key principle is structured data collection. Inspection results should be entered into systems that standardize formats and include relevant metadata rather than captured in free-form reports or images stored without context. Parameters such as asset identifiers, location, environmental conditions, and inspection methods provide the traceability needed for future reference and analysis. Without this context, inspection results lose much of their operational value.
- Equally important is data quality assurance. Utilities must be able to trust their inspection data, which requires mechanisms for validation, error checking, and repeatability. Standardized workflows and consistent methodologies reduce the variability that can arise from inspector subjectivity, shifting the emphasis from individual judgment to reproducible outcomes.
- Interoperability is another best practice that cannot be overlooked. Inspection data should integrate seamlessly with existing enterprise systems such as GIS platforms, enterprise asset management software, and regulatory reporting tools. By ensuring interoperability, utilities avoid the pitfalls of siloed data and can embed inspection results directly into planning, operations, and compliance workflows.
Several industry references provide guidance on how to implement these practices. IEEE Std. 1808-2024, Guide for Collecting and Managing Transmission Line Inspection and Maintenance Data, offers a framework for utilities to transition from fragmented or paper-based inspection practices to modern, computer-based systems. It emphasizes structured collection, metadata tagging, quality assurance, and long-term data governance, and has quickly become a touchstone for organizations seeking to formalize their inspection data processes.
Complementing IEEE standards, the EPRI field guidebooks provide practical frameworks for analyzing inspection results and deriving actionable insights. They bridge the gap between raw inspection imagery — whether from ultraviolet, thermal, or visual sensors — and condition assessments that can be integrated into asset management. EPRI’s methodologies are particularly valuable for utilities aiming to standardize severity scoring and risk evaluation across teams, ensuring consistent decision-making that extends beyond individual inspector experience.
Taken together, these practices and references demonstrate a shift in the industry: Inspection data is no longer treated as an operational byproduct but as a strategic resource. When managed correctly, it provides traceable, auditable, and actionable intelligence that supports both regulatory compliance and long-term improvements in grid reliability.
SENSOR TECHNOLOGIES IN GRID INSPECTIONS
Inspection practices rely on multiple sensor technologies, each of which detects distinct physical processes in assets.
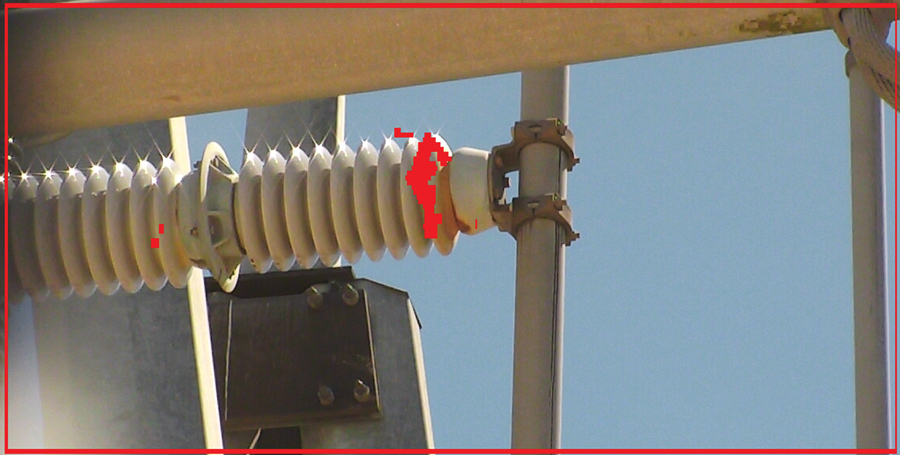
- RGB imaging provides the most familiar perspective: visual documentation of physical condition. It captures issues such as broken hardware, contamination, structural degradation, or vegetation encroachment while offering valuable context for situating other findings.

- Infrared thermography identifies thermal anomalies, such as heating at joints, loose connections, or overloaded components. These issues may not be visible to the naked eye, but they present as temperature gradients indicating inefficiencies or impending failures.
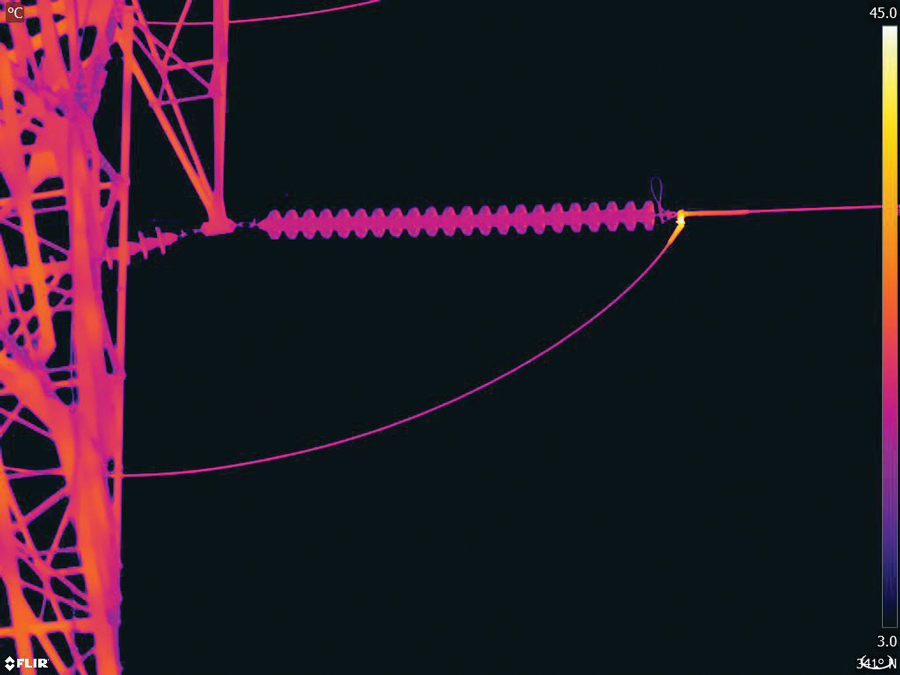
- Ultraviolet imaging detects corona partial discharges. Unlike infrared, which identifies heating effects, UV reveals electric field phenomena that often precede thermal symptoms. This makes it an essential early-warning tool for insulation degradation, damaged components, improper installation, and contamination issues.
Individually, these sensors provide useful but incomplete perspectives. Integrated together, they reveal a more comprehensive picture of asset condition, with each technology validating and contextualizing the findings of the others.
MULTI-SENSOR DATA INTEGRATION
The movement toward integrated platforms now enables UV, IR, and RGB data to be ingested into a single environment, synchronized in time and location, and combined with geographic or asset metadata. This fusion of data types represents more than just convenience. It allows different physical phenomena to be observed simultaneously, providing a layered and more accurate understanding of component health.
UV and infrared imaging, for example, are not interchangeable ways of detecting the same defect; they reveal different underlying processes. Ultraviolet cameras highlight corona discharges and surface discharges, which indicate high electric field stress often linked to insulation degradation or contamination.
Infrared imaging, on the other hand, records thermal emissions, making it particularly effective for detecting resistive heating in conductors, connectors, and other current-carrying parts. A corona discharge identified by UV does not necessarily produce detectable heat, while a thermal hotspot may develop independently of any UV activity. Observing both together provides a far more complete diagnostic profile than either could alone.
RGB imaging plays an equally important role. Inspectors use RGB imagery to identify physical defects, such as cracked insulators or loose fittings, that may explain anomalies captured by the other sensors. This cross-referencing ensures that inspection data is not abstract; it’s grounded in a verifiable representation of the equipment.
INTEGRATION OF INSPECTION DATA INTO ASSET MANAGEMENT
The true value of inspection data emerges when it becomes part of the larger asset management framework. On their own, images and sensor readings highlight anomalies, but without context, they remain difficult to prioritize. When inspection results are linked with asset registries, network topology, and especially geographic information systems (GIS), they are transformed from isolated observations into actionable intelligence.
GIS integration plays a central role because it anchors inspection findings to the physical structure of the grid. By connecting each detection to a specific tower, pole, or substation with precise coordinates, utilities can organize inspection records in ways that mirror the real-world layout of the system. This ensures that when a hotspot is found or a corona discharge is detected, maintenance crews know exactly where to intervene. Accurate location data is also critical for downstream processes such as issuing work orders, scheduling crews, or planning outage windows. Without geospatial grounding, even high-quality inspection data risks being underutilized.
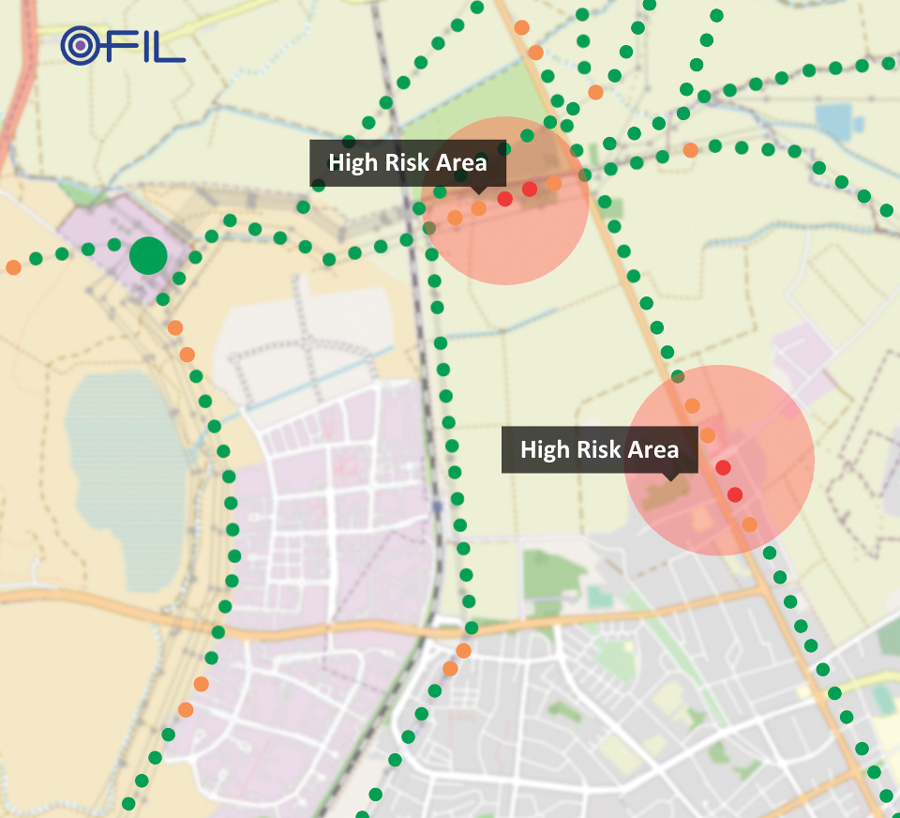
Beyond basic localization, GIS enables utilities to track asset condition over time. By maintaining a georeferenced history of inspections, teams can monitor how defects develop and whether they stabilize, worsen, or recur after maintenance. Overlays of inspection results across the network can also reveal spatial patterns of degradation — clusters of hotspots along a line segment or concentrations of corona activity in regions with heavy contamination or adverse weather. These patterns provide insights into systemic risks that would not be visible from isolated reports.
By embedding inspection results within asset management planning, utilities create a continuous improvement cycle. Data collected in the field informs daily operational decisions, validates long-term strategies, and feeds into investment optimization. Over time, structured integration ensures that inspections evolve from being snapshots of component condition into a strategic instrument for safeguarding power system reliability.
DIAGNOSTICS AND THE SEVERITY METHODOLOGY
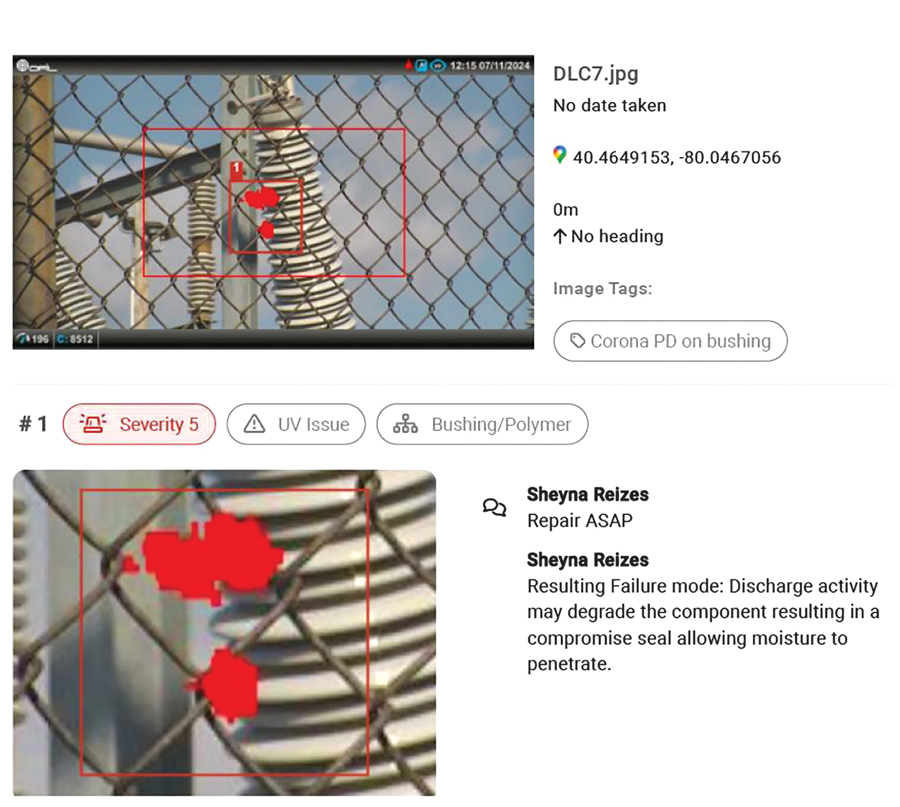
One persistent challenge in inspection data is subjectivity. Visual interpretation can vary not only between inspectors but sometimes even for the same inspector under different conditions, such as lighting, weather, or workload. This variability undermines consistency and makes it difficult to compare results across teams or over time. To address this problem, structured severity methodologies have been developed to convert qualitative findings into standardized, quantitative assessments.
Condition Assessment
The foundation of this methodology rests on two dimensions. The first is condition assessment, which is derived directly from inspection data. Ultraviolet imaging provides evidence of corona activity, infrared thermography identifies overheating at joints and connectors, and visual imagery documents cracks, contamination, or physical wear. On their own, these observations risk being interpreted subjectively; structured methodologies provide guidance on how to classify and score them.
This is where the EPRI field inspection guidebooks have become indispensable. These guides provide utilities with detailed procedures for interpreting inspection results, ensuring that findings are not left to individual judgment. Instead of relying on inspector intuition, evaluators follow a step-by-step framework that translates imagery and sensor readings into standardized categories of severity.
For example, a corona discharge observed at a certain location on a component will correspond to a specific severity class, while thermal anomalies above defined thresholds are mapped to graded risk levels. By anchoring the interpretation process in published criteria, the EPRI guides reduce variability and promote uniformity across organizations.
Importantly, the EPRI methodology does not stop at classification. It also offers actionable insights and recommendations. Each severity level is associated with guidance on what actions should be taken:
- High-severity findings may require immediate intervention or shutdown.
- Medium-severity issues may be scheduled for near-term maintenance.
- Low-severity findings may simply be monitored over time.
In this way, the EPRI frameworks directly link diagnostic results to operational planning, turning inspection data into a driver of decision-making rather than a static report.

Impact Parameters
The second dimension in structured diagnostics is the evaluation of impact parameters. While condition assessments describe what is happening at the component level, impact analysis reflects why it matters. Factors such as customer criticality, system redundancy, environmental exposure, and regulatory implications all influence how a defect should be prioritized. A cracked insulator may carry different levels of urgency depending on whether it is located on a redundant rural line or a substation that supplies critical infrastructure.
Severity Score Matrix
When combined, these two dimensions — condition and impact — form a severity score matrix. Each finding is placed within this framework, resulting in a numerical severity score that balances technical evidence with operational context. This approach reduces ambiguity, ensures traceability, and aligns maintenance actions with real-world priorities.
The benefits extend beyond consistency. Because the methodology is structured and auditable, inspection results can stand up to regulatory scrutiny and internal quality assurance reviews. Utilities can demonstrate that maintenance priorities are based on standardized, industry-validated frameworks rather than subjective judgment. Over time, the accumulation of structured severity scores also enables trend analysis, predictive modeling, and benchmarking across fleets of assets.
AI INTEGRATION AND FUTURE DIRECTIONS
Artificial intelligence is rapidly reshaping how inspection data is processed, analyzed, and applied in utility environments. Traditional inspections depended heavily on human interpretation, but AI models trained on ultraviolet, thermal, and RGB imagery now automate much of this work. These models are capable of autonomously detecting anomalies, distinguishing genuine events from noise, and quantifying their frequency and spatial distribution. By automating event detection, AI reduces dependence on subjective human judgment while producing consistent, auditable records that can be tracked across inspection campaigns.
AI’s role is also expanding from detection to multi-sensor correlation. By analyzing UV, thermal, and RGB data together, AI can recognize when anomalies across modalities reinforce each other, such as a corona discharge that coincides with resistive heating and a visible crack in an insulator.
Conversely, when anomalies are isolated to one modality, AI can flag them as lower confidence, reducing false positives and unnecessary maintenance. This fusion of data increases diagnostic accuracy and provides a stronger foundation for risk-based asset management.
Geospatial AI
A further step forward is the application of geospatial AI (GeoAI), which integrates inspection findings with GIS and environmental datasets. Once anomalies are geolocated, GeoAI can analyze their distribution in relation to surrounding conditions such as climate zones, pollution sources, or vegetation encroachment. These spatial analyses are particularly powerful when applied to the impact dimension of severity scoring. For instance, a cluster of corona discharges in a coastal region with high salt exposure may indicate systemic vulnerability, while hotspots concentrated near heavily loaded substations can highlight areas of elevated operational risk. By embedding geospatial context into the evaluation, AI contributes to detecting what is wrong and also quantifies why it matters.
Predicative Modeling
Looking ahead, AI will evolve beyond descriptive and diagnostic roles into predictive modeling. Probabilistic risk models, trained on large datasets of inspection findings and failure histories, will estimate the likelihood of asset degradation and failure over time. Instead of merely flagging existing anomalies, AI systems will forecast emerging risks, allowing utilities to intervene before reliability is compromised. This represents a decisive shift toward predictive and risk-informed maintenance planning, where inspection data serves not just as a record of the present but as a tool for anticipating the future.
SUMMARY: FROM DATA COLLECTION TO ACTIONABLE INSIGHTS
Utilities today are collecting more inspection data than ever before. Advanced sensors ranging from ultraviolet and thermal cameras to high-resolution RGB systems produce large volumes of imagery and associated metadata during every inspection cycle. At the same time, drones, mobile platforms, and fixed monitoring systems continue to expand the scope of what can be captured. The result is an abundance of information, but the central challenge has shifted: The critical task now is not collecting data, but extracting insights from it in a consistent, traceable, and decision-oriented way.
Meeting this challenge requires the adoption of new technologies such as computer vision models that detect anomalies, machine-learning methods that recognize patterns over time, and risk-focused AI models that estimate probabilities of failure. When properly integrated, these tools transform inspections from passive observations into predictive and risk-informed decision support.
However, the application of these technologies must be anchored in industry best practices and standards. Frameworks such as IEEE Std. 1808-2024 provide guidance on how data should be structured, validated, and integrated, while the EPRI field guides ensure that diagnostic methodologies remain standardized, auditable, and linked to actionable recommendations.
The ultimate goal is for inspection data to be organized in ways that directly support prioritization. Findings must flow into reports and dashboards that are consistent across inspectors and teams, structured around severity and risk, and designed to inform both operational and financial decisions. Utilities rely on these outputs to guide immediate interventions as well as to plan long-term investments, justify expenditures, and demonstrate compliance with regulators.
By combining structured data management, advanced sensing technologies, and AI-driven analysis, and aligning these processes with recognized industry standards, utilities can transform the growing volume of inspection data into a strategic asset. Done correctly, this approach supports regulatory compliance and enables smarter maintenance planning, optimized investments, and ultimately, improved reliability and resilience of the power grid.
REFERENCES
- IEEE. IEEE Std. 1808-2024, Guide for Collecting and Managing Transmission Line Inspection and Maintenance Data.

Sheyna Reizes is Vice President of Product at OFIL Systems.She has broad experience in B2B product management across multiple industries and works closely with cross-functional teams, including R&D, sales, and marketing. Sheholds a BS in mechanical engineering from Tel Aviv University and an MBA from The Open University of Israel.