
The most basic maintenance begins with our senses. Electrical and mechanical equipment tend to produce distinct sights, sounds, or smells before it fails. However, our senses have strict limitations.
- Bad sights, sounds, and smells are late indicators of defects. If a cable termination makes audible noise, you can be sure that the internal anomaly producing said noise has been metastasizing for quite a while. Our senses rarely enable us to locate early defect indicators when the cost of equipment repair would be cheaper.
- Our senses are severely narrow. For example, the visible light spectrum, the range of photon wavelengths available to human eyes, constitutes only 0.0035% of the electromagnetic spectrum. That leaves out 99.9965% of the spectrum. To fill that large gap, we need specialized equipment that goes beyond our senses. One such piece of equipment is a thermal imager/camera.
BACK TO SCIENCE CLASS
Anything above zero kelvin will produce infrared radiation. There is no molecular movement at 0 K, including electron movement. When electrons move back into inner atomic orbitals (which is only possible above 0 K), a photon is released. Photons constitute electromagnetic radiation. Gamma rays are photons. So are radio waves. The electromagnetic spectrum simply refers to the range of wavelengths and frequencies that photons can possess. Visible light constitutes photons with a wavelength from 0.38 μm to 0.75 μm. Above that wavelength, we have infrared radiation, which ranges from 0.75 μm to 1,000 μm. Most infrared cameras are equipped to detect radiation in the long wave zone, roughly from 8 μm to 14 μm.
For our purposes, all infrared radiation (also known as radiant power) measured by a thermal imager is emitted ϵ, reflected ρ, or transmitted τ (or some combination of all three) at a given wavelength (Figure 1). Mathematically, this means that ϵ+ ρ + τ = 1, where each variable is a unitless number ≤ 1.
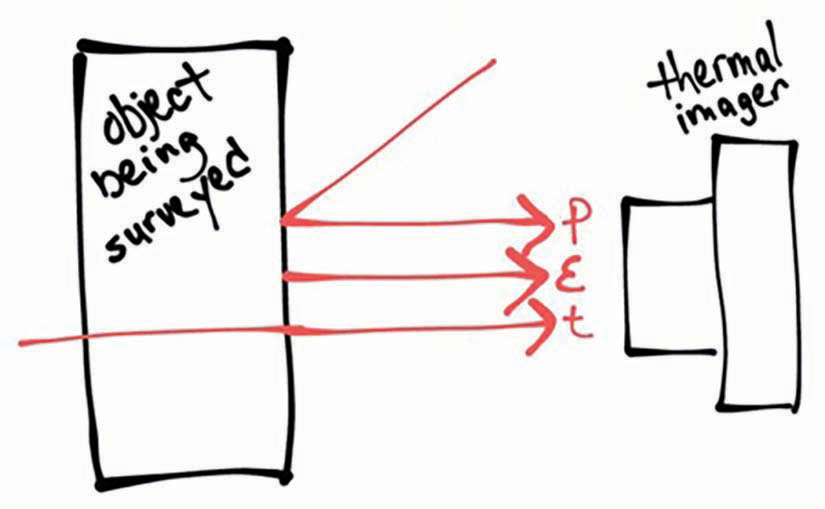
Objects can emit, reflect, and transmit infrared radiation at widely varying levels. Insulators like polymers and porcelain have high emissivities, meaning their infrared signatures largely reflect their own temperatures. By contrast, conductors like copper and aluminum tend to have low emissivities (particularly when they are polished). Instead, they have high reflectivities, meaning their infrared signatures largely reflect temperatures of background objects. Lastly, some objects like air have high transmissivities; their infrared signatures largely reflect objects behind them.
USING A THERMAL IMAGER
Suppose you want to measure the surface temperature of an opaque (τ = 0) object — let’s call it X. The thermal imager measures the incident radiant power Rmea of X in units called watts per steradian per square meter (Wsr-1m-2). Then, taking into consideration the radiation reflected Rref by X from background objects (i.e., the ambient temperature converted into radiant power via a pre-programmed radiance vs temperature curve) and the emissivity of X, it calculates the radiation Robj that strictly corresponds with X’s surface temperature via the following equation (Lanzoni, 2015):
Robj= (Rmea – ((1 – ϵ)Rref))/ϵ
After calculating Robj, the imager uses the same radiance vs. temperature curve for Rref to convert Robj to Tobj, the surface temperature of X (Figure 2). The transmissivity of the atmosphere can be safely ignored (i.e., τatm = 1) as a mathematical variable if viewing objects within 50 m (Lanzoni, 2015). Let’s do an example.
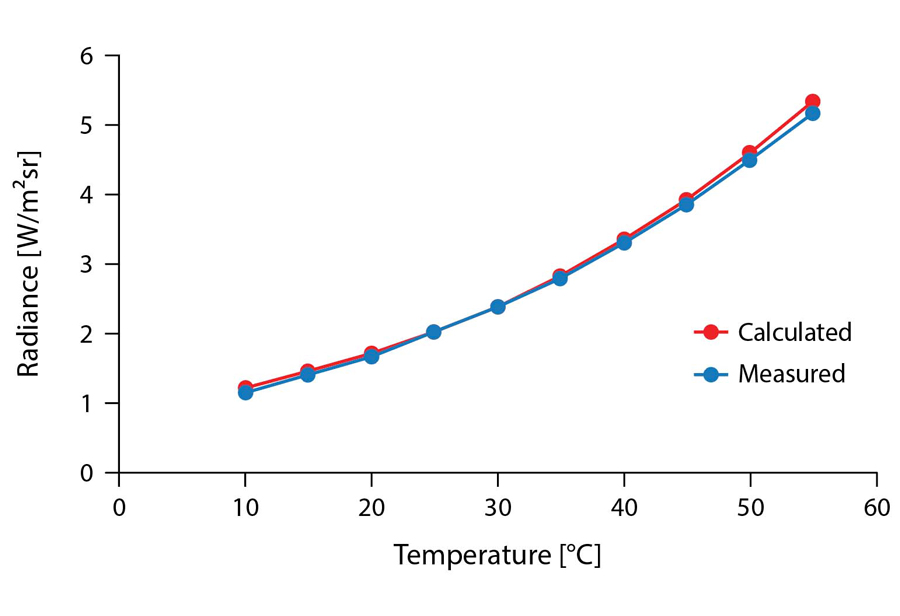
Suppose you want to measure the surface temperature of a cold-shrink splice in a TR-XLPE medium-voltage cable. Cold-shrink splices are typically made of synthetic rubber. The emissivity ϵ of rubber is at least 0.9. Suppose also that the ambient temperature is 20°C (this setting is not modifiable in all thermal imagers). After manually entering the ambient temperature (which the imager converts to approximately 1.61 W/m2sr as shown in the measured radiance vs. temperature curve in Figure 2), and the splice emissivity into the imager settings, you aim the imager at the splice. Say the imager measures a radiant power Rmea of 2.3 W/m2sron the surface of the splice. After that measurement, the imager makes the following rapid calculation:
Robj = (Rmea – ((1 – ϵ)Rref))/ϵ
Robj= (2.3 W/m2sr – ((1 – 0.9)1.61 W/m2sr))/0.9
Robj= 2.377 W/m2sr
2.377 W/m2sr converts to approx. 30.5°C IAW the measured rad vs. temp curve
Tobj = approx. 30.5°C = what appears on the imager screen
As you can see, correct emissivity settings are critical for accurate temperature readings. Overestimating the emissivity of a target object will lead to underestimating its temperature. Luckily, emissivities for various materials can be easily referenced.
BACK TO THE FIELD
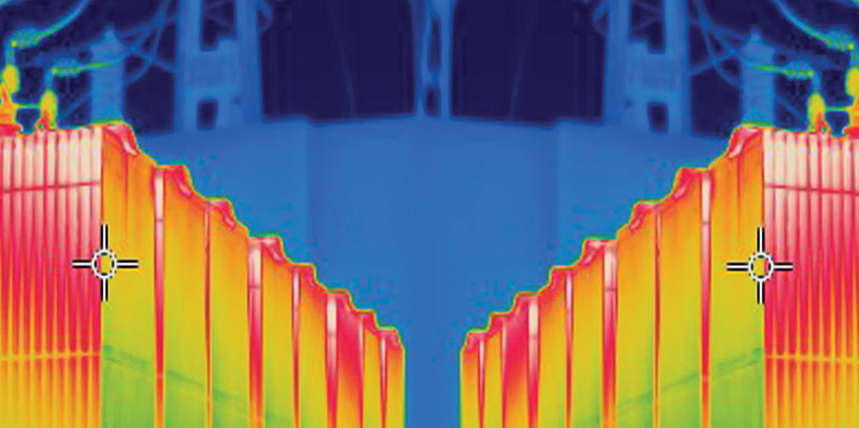
I perform thermographic surveys as part of my personal electrical inspection routine. When I arrived on site during a year-long, overseas deployment as a medium-voltage power plant operator for the U.S. Army Corps of Engineers (USACE), I immediately began surveying the plant with my personal imager, a Klein TI250. Just a few minutes into my very first survey on my second day of shift work, I found a thermal anomaly, better known as a hotspot, i.e., an area of overheating, on one of the terminals of a generator battery bank (Figure 3).
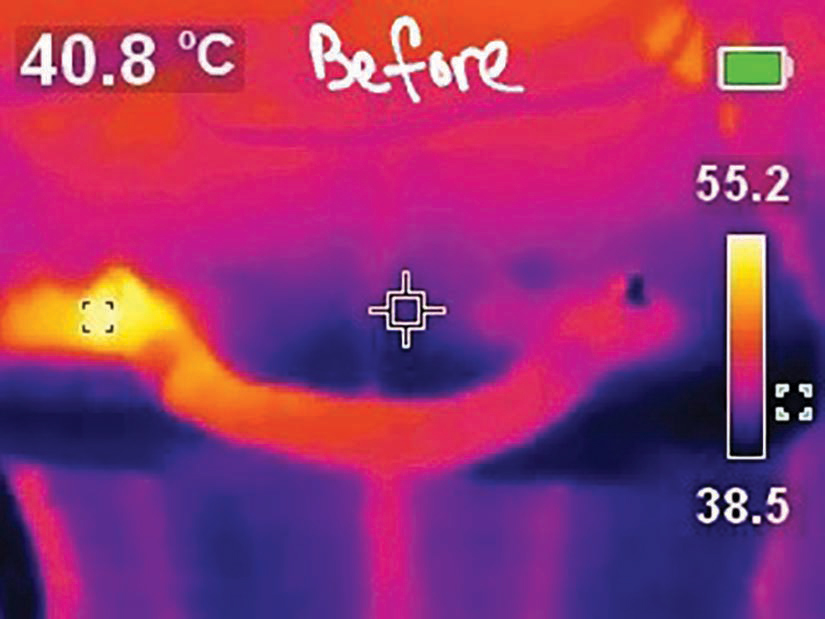
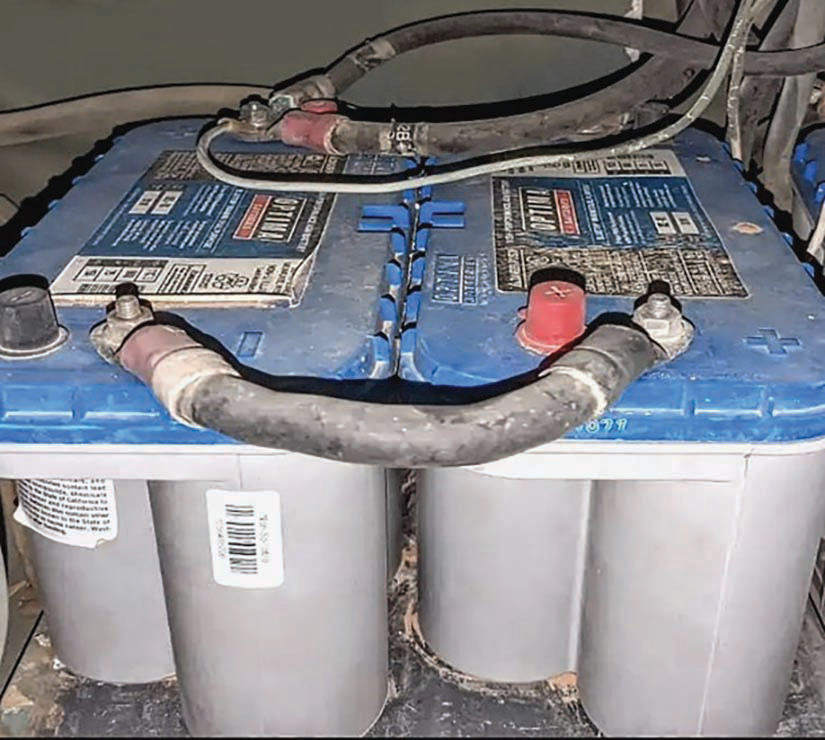
Electrical hotspots are usually caused by loose connections (loose connections cause high resistance and high resistance produces extra heat). Loose connections occur particularly often on generators because they are constantly vibrating, thereby reducing the clamp load of bolted connections. But when I moved the battery strap to see if it was loose, it didn’t budge as I expected. Maybe the nut on the threaded terminal needed to be re-torqued just a few ft-lbs, I thought.
I noticed other defects as I inspected further. The ammeter on the battery bank charger was fluctuating wildly. I checked the current again on the battery strap with a DC clamp-on ammeter, and sure enough, the ammeter reading kept fluctuating between 2 A and 5 A. I know from both experience and my reading that battery chargers are supposed to rectify AC into non-pulsating DC. Fluctuating current, otherwise known as ripple current, occurs when the rectifier on a battery charger malfunctions. DC that has been rectified from AC still pulsates like AC. Rectifiers require a series of inductors and capacitors to filter the pulsating DC into smooth, non-pulsating DC. If any of those capacitors or inductors fail, the DC will begin pulsating again.
Ripple current leads to continual charging and discharging of battery banks, creating undesirable heating that can eventually lead to thermal runaways, especially on valve-regulated lead-acid batteries, which happened to be the only batteries used in this plant.
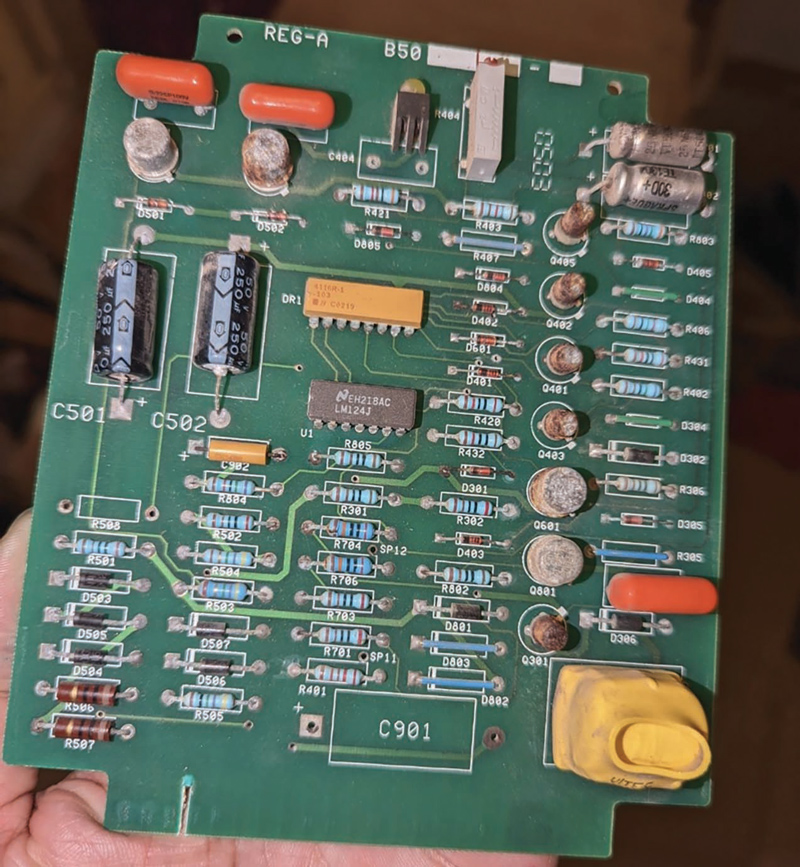
When we pulled the rectifier card (pictured) from the charger, we weren’t surprised. The card was visibly worn, and many of the bipolar junction transistors had developed rust. We replaced the old card with a new one, and when I conducted my survey the next day, the thermal anomaly had disappeared.
LESSONS LEARNED
- Do infrared thermographic surveys — often. Infrared surveys vastly extend our sense perception, enabling us to detect a whole host of anomalies, defects, and faults that are otherwise concealed. Moreover, they are non-destructive and do not require scheduled shutdowns. There’s a reason why thermographic surveys figure prominently in ANSI/NETA MTS-2019. They have their own section (#9), their own table (100.18), and feature as a visual/mechanical inspection performance step for basically every testable component in Section 7.
- Compare and contrast similar pieces of equipment. Equipment in good condition will perform similarly under similar circumstances. The charger in question was the only one in the plant that fluctuated; the rest were steady. This was a tell-tale sign that either circumstances were different or the equipment was not in good condition. Circumstances hadn’t changed, so that narrowed it down to equipment condition.
- Diagnostics are everything. One way of comparing equipment is to gather data. Similar equipment under similar conditions will yield the same data, e.g., the same temperature, the same current, the same voltage, etc. You can’t investigate an anomaly if you don’t know it exists, and the best way to become aware of anomalies is through gathering data.
REFERENCES
Lanzoni, D. (2015). 2.1.4. Infrared Thermography: Electrical and Industrial Applications (pp. 43-47). CreateSpace Independent Publishing Platform, ISBN 1511836679.
Lima Filho, G.M.; Almeida, R.D.; Castro, R. M.; & Damião, A. J. (2017). “Operational Measurements for Infrared Camera Characterization.” Journal of Aerospace Technology and Management, 9(4), 519-528. doi:10.5028/jatm.v9i4.589.

Michael Labeit is a Prime Power Production Specialist, Lineman, and NETA Level 2 Technician in the 249th Engineer Battalion, U.S. Army Corps of Engineers. Michael has operated and maintained medium-voltage power plants in Turkey, Saudi Arabia; Ft. Leonard Wood, Missouri; and Ft. Bragg, North Carolina. He is presently overseas and in charge of condition-based maintenance for Defense Department electrical assets. His team won 1st place in the military division at the 2021 International Lineman’s Rodeo in Kansas City. He graduated from Prime Power School in 2018 and has an AS in applied science from Excelsior College.