

To explain VLF tan delta, we must first explain the reason it was developed and how the concept and equipment used to perform this test came about. Tan delta is still a form of high-potential (hipot) testing but utilizes the advantages of both AC and DC testing while eliminating many, but not all, of the disadvantages. The very-low-frequency (VLF) portion is explained in a short synopsis of AC and DC hipot testing that covers the good, bad, and ugly of each test.
Most test technicians have been required to perform dielectric voltage withstand testing, also known as high-potential testing, on cables. They usually discovered the differences between AC and DC testing the hard way, whether performing acceptance or maintenance testing.
Both hipot tests have natural advantages and disadvantages that are apparent depending on the equipment under test. The difference between AC and DC voltage and current becomes clear after a few hard-learned testing situations.
Every young test tech asks why the test voltages for DC and AC hipot testing are not the same. My immediate answer is a question: “Are 120V DC and 120V AC the same?” The initial answer is “Yes” until the tech sees me cringe and thinks about the question. Once I ask, “Do the words root mean square (RMS) and peak voltage mean anything to you?” the answer becomes intuitively obvious and the reason for the difference in voltage falls into place. They now understand that for the stress level of DC voltages and AC voltages to be equivalent, DC must be raised to the peak value of AC, which equates to 1.414 of the AC value. The tech often asks a follow-up question: “How do you determine the value of voltage to use for a specific test?”
My answer is less from an engineering perspective than from an on-the-job training point of view. There are very accurate ways to determine the exact answer, but this rule of thumb works very well in most cases: The AC value equals 2 times 120% of nominal line voltage + 1000 V, applied for a unit of time. The DC test voltage would just be the peak AC equivalent. The test time for most standards, including products covered under IEC 60950, is 1 minute.
DC Hipot
DC hipot testing measures the insulation resistance of cables by applying high voltage in steps or ramping up the voltage between the center conductor and shield. The leakage current is measured, and resistance is calculated using Ohms Law to obtain the insulation resistance. One negative aspect is that the cable conductor, shield, and insulation form a capacitor that initially acts as a short circuit while charging the capacitance of the cable — as we all have seen on our analog test set current meter — by bouncing the needle off the right-hand side of the meter case. This requires understanding how to properly run the hipot and why this issue occurs. The instantaneous current surge can damage service-aged cables during the test due to the instantaneous over-voltage applied. Therefore, the test tech must ramp the voltage up in small increments to keep the charging current minimal and to avoid tripping off the test set during the charging interval.
Since the applied DC voltage on the test specimen is higher than for an AC hipot test, it is more prone to flash-over and corona discharges. The tech must utilize corona balls and bagging techniques to minimize the problem during the test.
When performing a DC hipot test, the capacitance of the circuit will maintain the applied voltage; therefore, a discharge circuit or other means to protect the test tech from possible lethal shock is required.
The DC hipot test is typically recommended only for new cables, but it is sometimes used on service-aged cables. One of the advantages of a DC test is that the leakage-current trip points can be set to a much lower value than an AC test voltage. That makes it possible to separate out specimens that have marginal insulation that would have been passed by an AC tester. There is some evidence that HVDC testing of aged extruded dielectric (particularly XLPE) cable is harmful and may result in failure of the cable when re-energized with AC or shortly after.
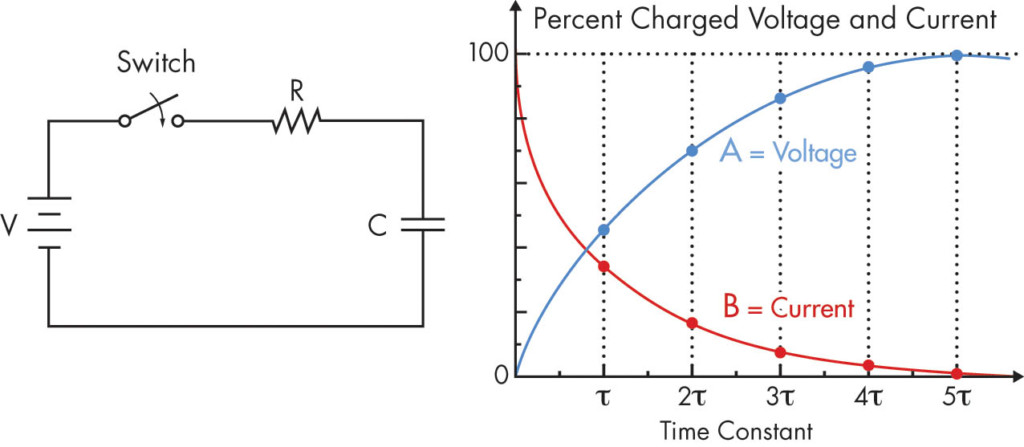
Figure 1: Capacitance Charging Using DC
A simple circuit and graph (Figure 1) plots the charging of a capacitor using DC and shows initial voltage and currents from no charge to fully charged after five time constants (TC) where TC = RxC.
AC Hipot
The AC hipot test, on the other hand, is performed by applying high-voltage AC on the conductors to be tested and measuring the current. Test results show a much higher current reading because the cable now performs both as a capacitor and a resistor in parallel. The center conductor acts as one plate of the capacitor and the outside layer represents the opposite plate separated by the dielectric insulation in the middle. AC current flows easily on a capacitor due to reversal of polarity, whereas DC current decreases as the effective capacitance of the cable charges to the test voltage. The AC voltage applied on the test conductor is lower compared to DC, but it requires considerably higher amounts of power because at 60 hertz, capacitive reactance is very low. Most test set power supplies have limitations that adversely affect the size of the specimen that can be tested and force the use of DC testing.
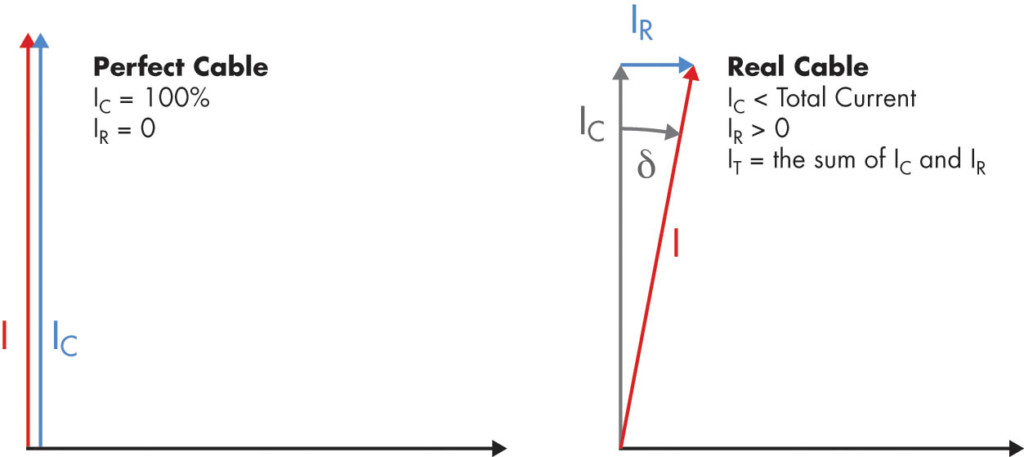
Figure 2: DC Hipot Test Currents
AC hipot tests include capacitive current (IC) and resistive current (IR) in parallel (Figure 2). The capacitive current is out of phase, leads the voltage by 90 degrees, and is typically large relative to the leakage (resistive) current. Thus, the charging current masks the leakage current and the test is only Go/No-Go; it is not diagnostic.
The problem with AC hipot testing is the ratio of the resistive component and the reactive component. Leakage current in the specimen under test caused by defects can be easily overlooked (Figure 3).
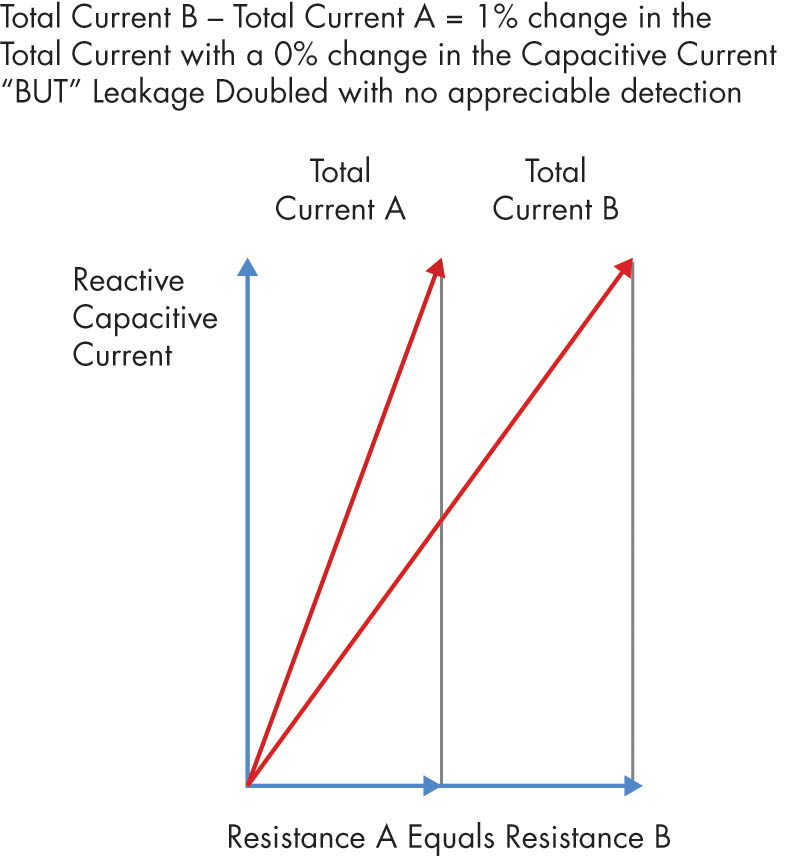
Figure 3: AC Hipot Test Currents
Hipot Summation
Technicians face many challenges in AC and DC hipot testing that must be understood to accurately diagnose the condition of insulation in cables or any other device.
AC hipot source frequency plays the largest role in the amount of power required to charge the capacitance of a test specimen. The use of low frequency — such as 0.1Hz that is normally used — reduces the power requirement by 600 times as compared to 60 Hz tests. This means the lower the frequency, the larger the Xc, resulting in a smaller, more portable power supply that can drive larger, longer cables.
The measurement and diagnostic side is tan delta or dissipation factor. Most technicians routinely perform power factor (PF) testing. If they understand the theory of PF testing, they also already understand dissipation factor and just didn’t realize the correlation between the two.
In Figure 4, power factor is the cosine of the angle theta formed by the ratio of total current and resistive current, whereas dissipation factor is the tangent of the angle delta formed by the ratio of total current and capacitive current. The cosine of theta and the tangent of delta are comparable for results up to 10% PF.
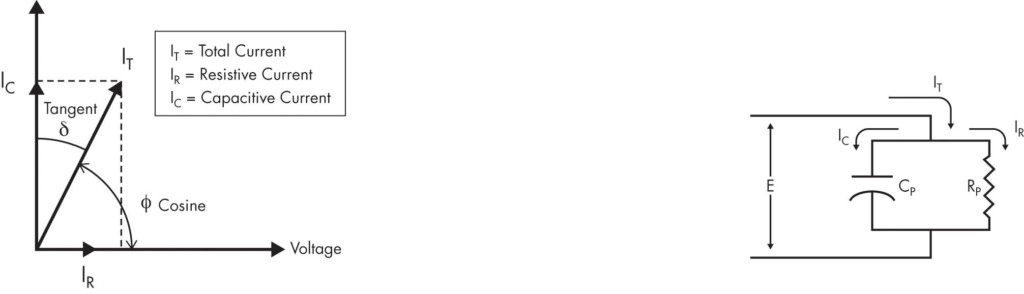
Figure 4: Comparison of Power Factor and Dissipation Factor Angles
VLF Tan Delta
In a perfect capacitor, voltage and current are shifted by 90 degrees with the current leading the voltage. In a perfect cable, current is purely capacitive with zero resistive current. In reality, there is always a small amount of impurities in the dielectric; ageing and damage to the cable creates additional resistive paths and passes current to ground that can be identified and measured.
Since the cable is not perfect and there is resistive current, the phase angle is not 90 degrees, but something less. The amount of phase angle shift is proportional to the level of contamination and damage. Test equipment and associated software measures the shift in phase angle, displays the applied voltage, creates the graphical waveforms, and calculates the tan delta number, which provides excellent and easy to interpret results.
Tan Delta Performance Measurement
The cable to be tested would be de-energized, disconnected, isolated, and tested for absence of voltage. Anything that is part of the test circuit will affect the results, including items such as terminations and equipment that cannot be disconnected. The ends of the cable must be prepped, cleaned, and bagged to prevent corona and partial discharge issues that would adversely affect the test results. The voltage is then raised in steps (Figure 5), typically one-half the normal operating voltage starting at 0.5Uo, where the letter “U” represents a unit of voltage based on dividing the operating voltage into quarters. The test steps would equal 0.5Uo, 1.0Uo, 1.5Uo, and 2.0Uo. At 2.0Uo, the test voltage is held for a predetermined amount of time, typically 30–60 minutes, called withstand. This test is Go/No-Go. At the end of the time, the voltage is reduced to zero.
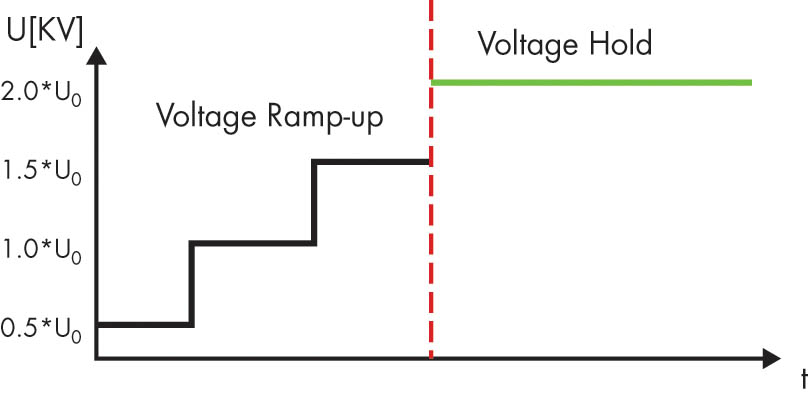
Figure 5: Application of Voltage
The tan delta numbers at the lower voltage are then compared to those at the higher voltage (Figure 6). If the insulation could be perfect, the line would be horizontal when the T/D numbers for each voltage are graphed. In less than perfect insulation, the tan delta numbers will increase as the voltage is increased.
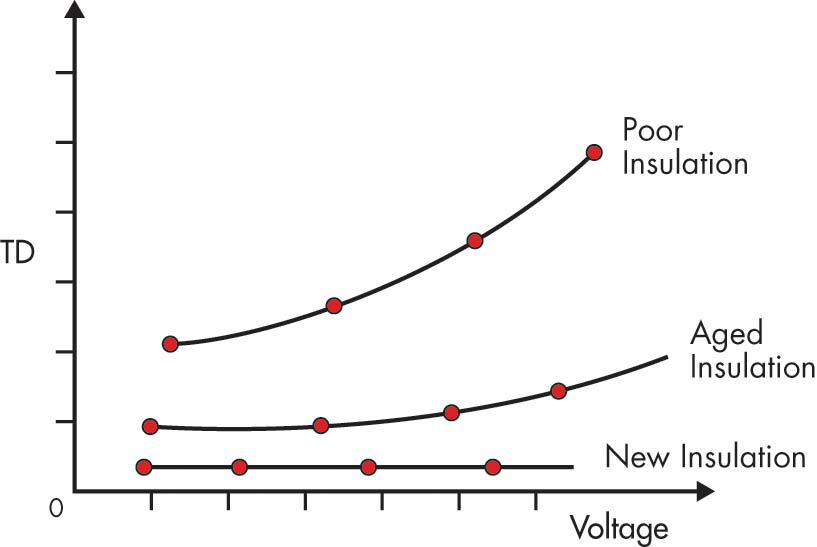
Figure 6: Tip-Up Curves for Various Cable Conditions
IEEE Std. 400-2.2013, IEEE Guide for Field Testing of Shielded Power Cable Using Very Low Frequency (VLF)(less than 1 Hz) provides recommended test voltages, test times, and withstand hold times for different types of cables.
Interpreting Results
Understanding the results requires some experience. Results are divided into good, marginal, and deteriorated categories:
- Good indicates the cables test well and can be returned or placed into service for the first time.
- Marginal means tan delta values indicate areas of poor or damaged insulation in the cable system and further information on the cable is required to determine if the cable is safe to return or place in service.
- Deteriorated indicates the cable system has extremely high tan delta values indicating a significant problem and should not be returned to service.
In all cases, a previous benchmark test provides the easiest means to compare the latest test results. However, a benchmark is not necessary to obtain accurate assessment as can be observed in the actual test data sets seen in Figure 7, Figure 8, and Figure 9.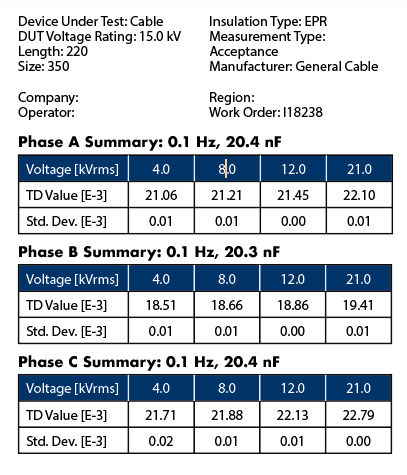
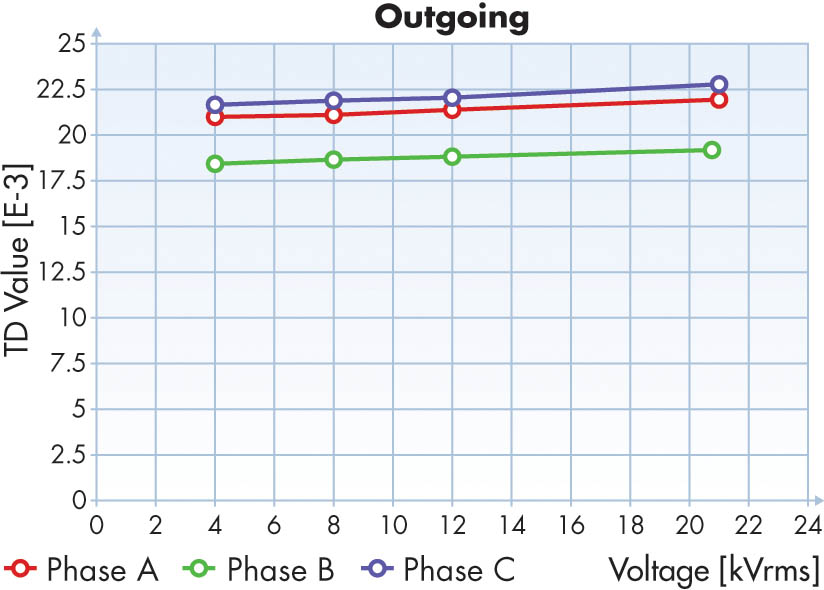
Figure 7: Results on Good Cable
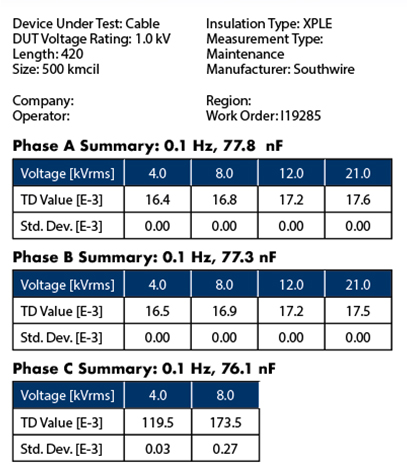
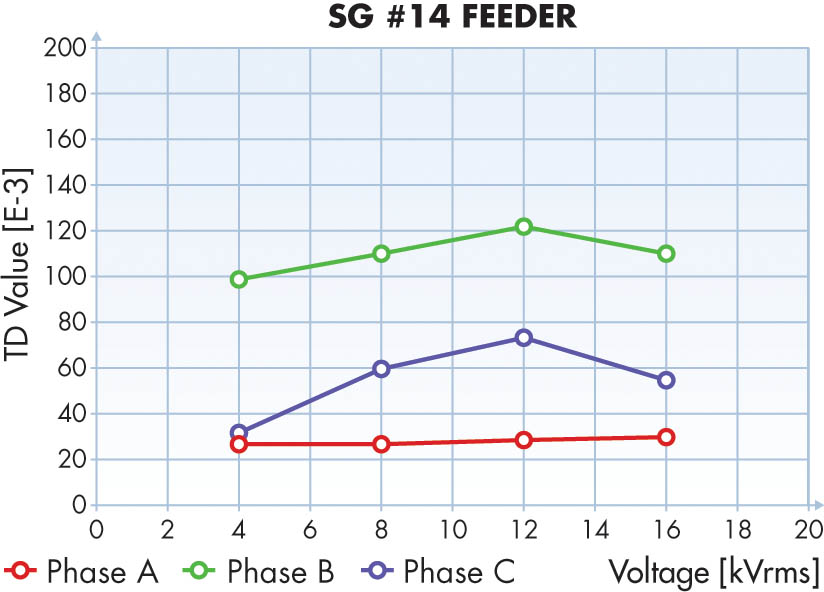
Figure 8: Results on Marginal Cable

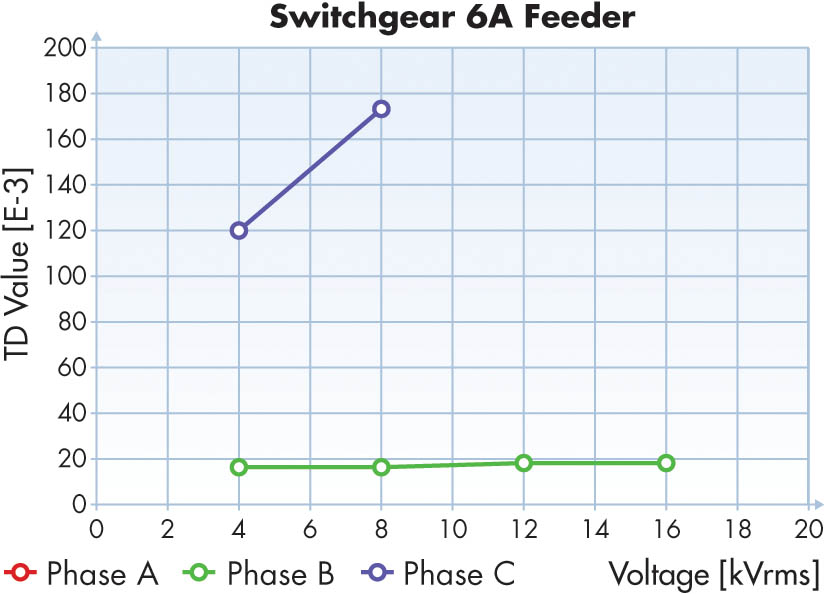
Figure 9: Results on Deteriorated Cable
Just as in power factor, dissipation factor/tan delta is very linear for any applied test voltage. If the cable is damaged, the change in the capacitance and/or resistive watts loss will cause a change in the graphical analysis and will no longer be flat or linear; therefore, the sharper the climb (tip-up) with increased voltage, the greater the existing damage. A change in either the resistive element or the capacitance directly shifts the results, although it is most often a resistive shift rather than a capacitive shift that causes the changes in T/D results and curves. This may be due to contamination, water treeing, partial discharge, moisture, or poorly installed terminations to name a few. It is a test technician’s responsibility to recognize that a problem exists and determine whether the cables are safe to energize. With practice, most techs will be comfortable performing this much more reliable test technique.
Conclusion
This brief description of hipot versus tan/delta demonstrates that tan/delta incorporates the “good” of DC and AC hipot as well as eliminating many of the “bad” of both by incorporating low-frequency AC to minimize equipment power supply needs and providing test results that are easy to obtain and evaluate. The graphical analysis provided by the software provides uncomplicated identification of problems for both the technician and the end user or owner of the cables. Depending on the equipment manufacturer, the results can be sent by Bluetooth to a laptop; this makes the test much safer for the test technician and practically fully automated.
 Rick Youngblood is responsible for utility contracts as well as in-house training for all technicians at Electrical Maintenance and Testing in Carmel, Indiana. After leaving active duty Air Force, Rick finished his engineering degree at Purdue University and worked for PSI Energy as a Project Engineer responsible for substation maintenance and testing. He finished his 25-year career with Duke Energy as Manager of Substation Services responsible for all aspects of substation maintenance and test. After retiring from Duke, Rick and his partner opened up a branch of American Electrical Testing in Indianapolis concentrating on utility business, where he earned his NETA Level 2 and Level 3 Technician. Rick retired a second time after seven years and closed the Indianapolis division of AET. Finding retirement unsatisfying, Rick became a Client Service Engineer for Doble Engineering, where he dealt with all utilities from a training perspective for the Great Lakes region for seven years.