

Methods to check medium voltage cable integrity have evolved drastically in the last 30 to 40 years. The DC hipot test has largely been replaced by the 0.1 Hz very-low-frequency (VLF) test, and North American (IEEE) and European (IEC, CE, CIGRE) standards specify the VLF test method for solid dielectric medium-voltage cables.
Throughout these years, the 0.1 Hz VLF test has proven to be a reliable test method to perform acceptance and preventive maintenance testing of medium-voltage cables. Like any proof test method, it is a go/no-go test and has limited diagnostic capabilities. However, the scope of the 0.1 Hz VLF proof test method can be greatly expanded into a predictive/diagnostic field test method.
This expansion can be accomplished in one of two ways:
- Combine the 0.1 Hz VLF proof test method with a trending indicator such as tan delta, partial discharge level, or leakage current during the withstand test. In IEEE 400.2, this is called a monitored withstand test.
- Use 0.1 Hz VLF technology as a voltage source for either tan delta or PD testing.
These are predictive and diagnostic methods to assess the insulation of medium-voltage power cable systems as well as cable accessories like terminations and splices.
This article reviews the important aspects of the VLF and PD tests. The PD test can identify not only incipient discharge defects (primarily workmanship issues) but can also provide the location of the defects within the cable system. The straight 0.1 Hz VLF withstand test as a pure proof test cannot provide either of these important pieces of information.
VLF Test
The VLF test is a go/no-go AC overvoltage test at 0.1 Hz. The test voltage levels are between 2 Uo and 3 Uo, where Uo is the rated phase-to-ground voltage (RMS) and the test time varies between 15 and 60 minutes.
IEEE 400.2 is the North American Guide for the VLF field test on medium-voltage, shielded power cables. The two approved VLF technologies are based on the 0.1 Hz sine and 0.1 Hz cosine rectangular wave shapes.
VLF Technologies
The difference in the available technologies is reflected in the wave shape (sine and cosine rectangular) of the 0.1 Hz AC voltage. Aside from this difference, the technologies share common aspects. Both show significant variations in growth rate for electrical trees when compared to that at power frequency. Figure 1 shows that at test voltage of 3 Uo RMS, the growth rate is 10 mm/hour for both wave shapes at 0.1 Hz frequency. However, if the sine wave frequency is decreased to 0.01 Hz, the growth rate also decreases by ten times to 1mm/hr.
VLF testers using any 0.1 Hz AC frequency are substantially smaller in weight and size when compared to 60 Hz equipment. The ratio for the required input power for a given test voltage and cable capacitance between the 60 Hz and the 0.1 Hz cosine rectangular is 20 to 1 and still 5 to 1 between the 0.1 Hz sinusoidal and the 0.1 Hz cosine rectangular wave shapes.
This difference is directly related to the fact that the full charging energy for each half wave must be provided and dissipated twice within each cycle. The 0.1 Hz cosine rectangular technology utilizes a patented energy-recovery system (LC resonance circuit) that recovers approximately 90% of the required charging energy between half waves. Energy recovery is essential to accomplish polarity reversal within the same time period as under 60 Hz.
The difference in wave shape has a significant effect on the rate of change of the potential (dV/dt) during the transition from one polarity to another. For 60 Hz power frequency, this transition happens within 8 milliseconds. The sinusoidal 0.1 Hz wave takes 5 seconds or approximately 1,000 times longer to change the polarity, which translates into significantly lower electrical stress potential. In comparison, the cosine rectangular 0.1 Hz wave accomplishes the same transition in only 5 milliseconds on average, thus matching the 8 milliseconds of the 60 Hz power frequency very closely.
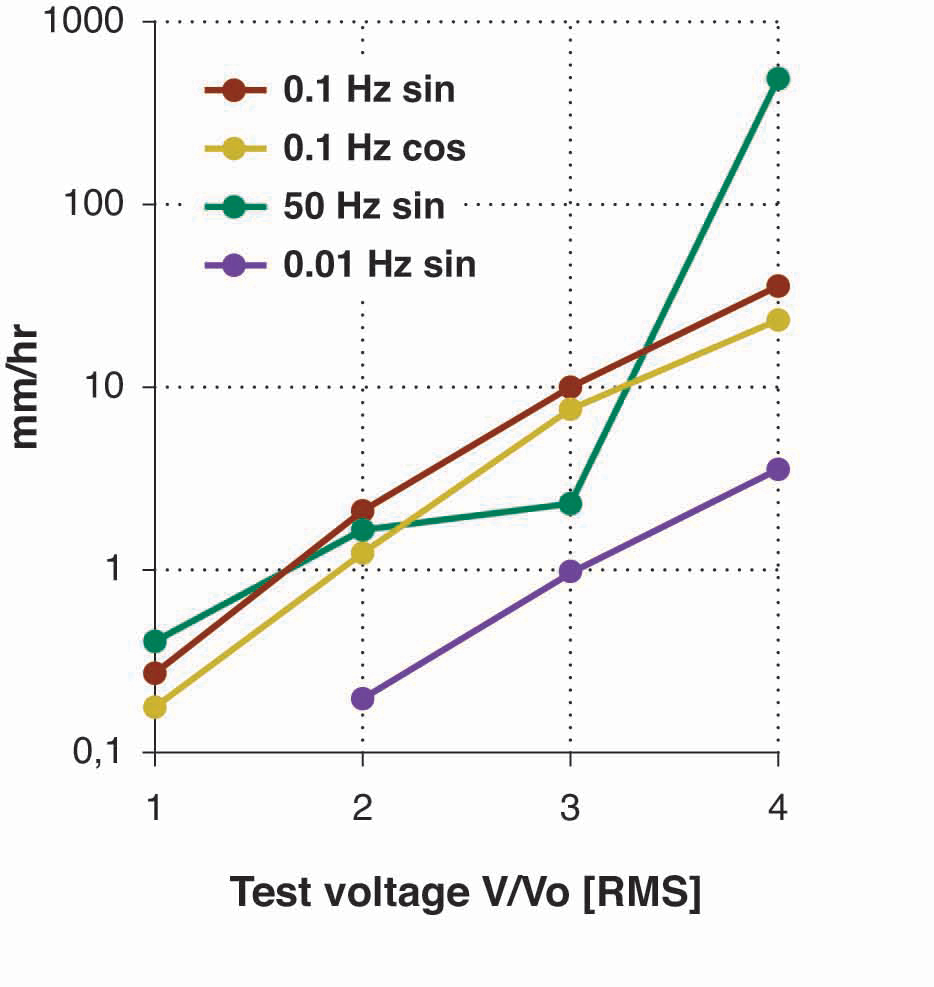
Figure 1: Electrical-Tree Growth Rate
(mm/hr) as Function of Test Voltage for Four Testing Frequencies
When a test voltage of 3 Uo RMS is applied, the sinusoidal 0.1 Hz wave compensates for the lower electrical stress (dV/dt) with a higher peak test voltage with respect to the cosine rectangular wave. This creates a similar growth rate of electrical trees for both wave shapes (Figure 1). The 0.1 Hz cosine rectangular technology exhibits lower electrical tree inception voltage because it replicates the electrical stress at operating frequency compared to 0.1 Hz sinusoidal (Figure 2) while at the same time providing accelerated growth of electrical trees at 0.1 Hz (Figure 1).
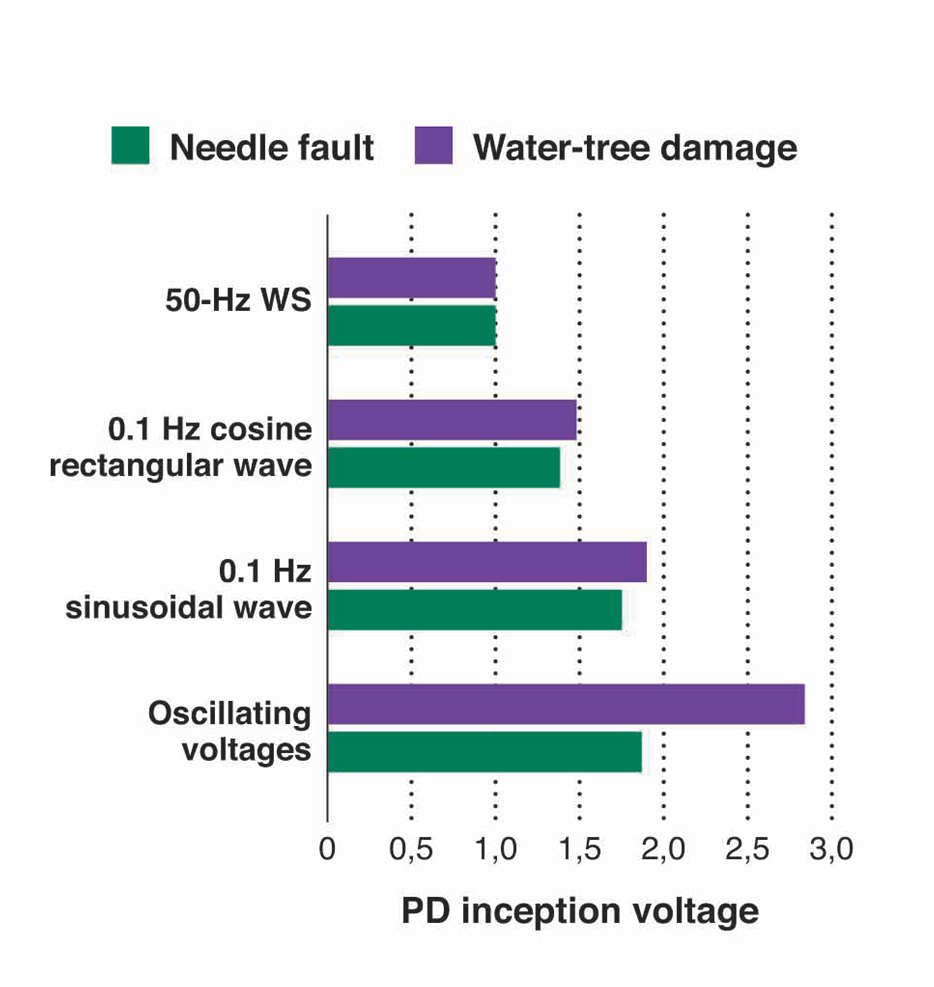
Figure 2: Needle-Fault and Water-Tree Damage vs. Inception Voltage
Because sinusoidal technology cannot recover the charging energy, sinusoidal test sets are offered with lower test frequencies in addition to 0.1 Hz, including .02 Hz, .05 Hz, and even .01 Hz to be able to test cables with large capacitance. When this solution is applied, the duration of the test must be increased inversely proportional to the reduction in frequency to at least match the number of total cycles to that at 0.1 Hz. Published test results show a significantly slower (10 times, see Figure 1) growth rate for 0.01 Hz compared to 0.1 Hz. The fact that the electrical stress dV/dt for lower frequencies is substantially less than at 0.1 Hz makes it difficult to compare test results between 0.1 Hz and .05 Hz or .02 Hz or .01 Hz even when increasing the test duration. No statistical field test data have been published to validate the equivalence of these lower frequencies in terms of meaningful test results when compared to 0.1 Hz. IEC 60060-3 provides only 0.1 Hz frequency; the IEEE 400.2 Guide mentions lower frequencies for withstand testing but provides no related test parameters in conjunction with them.
Another difference must be taken into account when comparing the test voltages for both technologies, which are specified as RMS value in the European Standard CENELEC 620/621 (typical for all AC testing). In IEEE 400.2-2013, however, the test voltages are specified as peak-based for sinusoidal technology and as RMS-based for cosine rectangular technology. Because peak and RMS value are the same for the cosine rectangular wave shape, the peak values for both technologies are the same per IEEE 400.2. However, compared on an RMS basis (typical for AC testing), the sinusoidal 0.1 Hz technology has approximately 30% lower RMS value (see also Figures 1 and Figure 3).
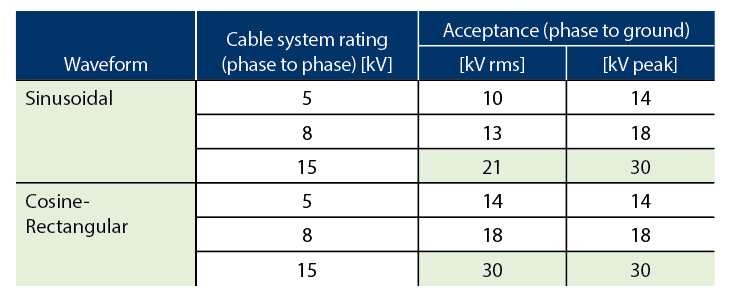
Figure 3: Excerpt from Table 3, IEEE 400.2-2013, Page 11
Test Parameters
It is important to recognize that the test parameters for duration and voltage are not arbitrary. They are based on the existing AC test standards at power frequency, which call for 2 x Vo RMS, as well as on the results from experience with a large field database in combination with a number of laboratory tests. Due to the nature of the failure mechanism in XLPE cables, voltage of a specific level (2 to 3 Uo ) should be applied for a test time of 60 minutes to convert critical-size water trees into electrical trees (voltage dependent) and cause them to grow and fail during the test time (energy = power x time shows the importance of time). By maintaining a 60-minute test time on service-aged cables, future in-service failures can be statistically avoided. Many times, the cosine rectangular technology permits all three phases of a cable to be tested simultaneously, which compares very favorably with a typical old-school 15-minute DC high potential test for each phase. However, this does not allow the conclusion that a 15-minute DC test is equivalent to a 60-minute (AC) VLF test. On the contrary, DC tests have proven ineffective and damaging when used on XLPE cables due to the different mechanisms of the methods.
Test Parameters Versus Meaning of Test Results
Since the late 1980s when the 0.1 Hz cosine rectangular technology was first introduced, thousands of XLPE cables have been tested by applying a 60-minute test duration and a test voltage of 2 to 3 Uo. A cable that passes this test protocol will statistically not fail within the next 2–3 years (assuming critical-size water trees are not present). Generally, a change in test parameters (voltage and/or time) will produce test results that require a new interpretation, which itself requires a substantial and new database with field test results. The results between sinusoidal 0.1 Hz and cosine rectangular 0.1 Hz are comparable provided the test voltage is based on the RMS value and test times are identical.
Limitations of the 0.1 Hz VLF Test
The 0.1 Hz AC VLF test will detect severe problems related to manufacturing defects and/or workmanship issues during a commissioning test provided the test voltage and test time have been set up according to the standards. However, it cannot convert incipient problems into a test failure, for instance, a too-small bending radius or a small cut in the insulation.The partial discharge diagnostic method is an excellent tool to uncover small and incipient workmanship problems or manufacturing defects, provided they are accompanied by a gas (partial) discharge. It complements the 0.1 Hz VLF withstand test and significantly increases the value and meaning of the test results.
Offline Partial Discharge Test Sources
The increasingly complex installation of medium-voltage accessories has resulted in many cable failures due to poor workmanship in splices and terminations, for example, in windfarm installations. Figure 4 shows that 68% of failures occur in locations where technicians perform work; 25% of failures occur mid-cable, where technicians typically do not work directly on the cable. These are mostly related to laying or trenching or point to manufacturing issues.
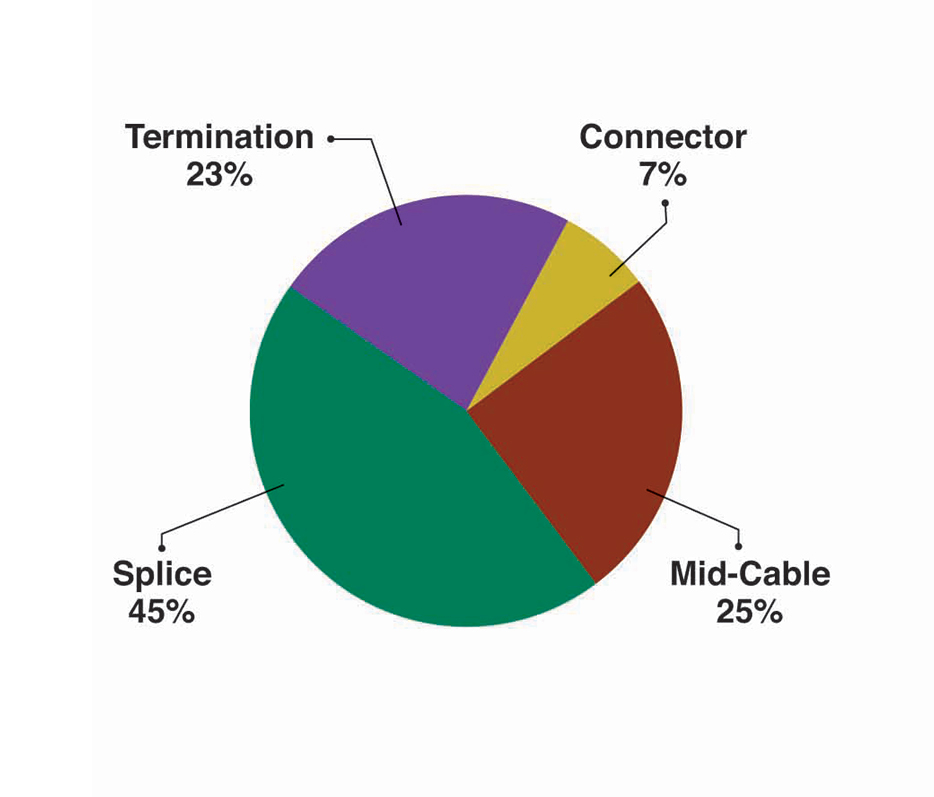
Figure 4: Location of Final Cable Fault
The offline partial discharge test has proven its efficiency in detecting poor workmanship, installation problems, and manufacturing defects. Therefore, it is recommended to perform a PD test to detect these problems before the commissioning VLF withstand test or as part of a monitored withstand test. This article constrains the discussion of the offline PD test to the two technologies more widely used in medium-voltage cables: the VLF-PD test and the damped alternating current (DAC) voltage test (Figure 5).
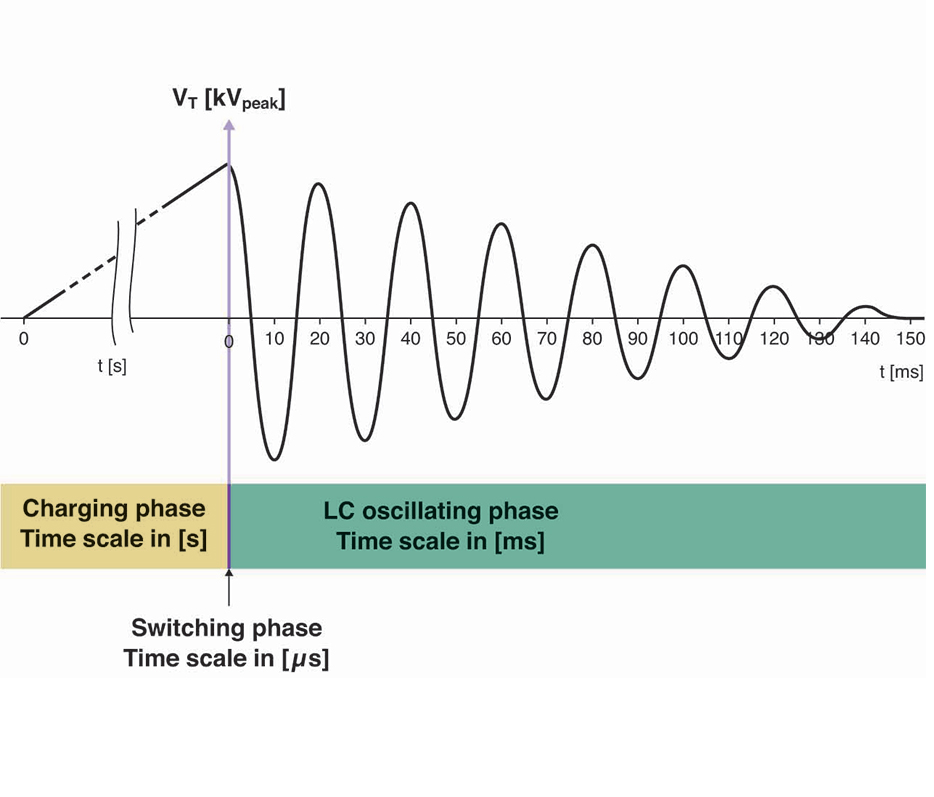
Figure 5: Schematic Overview of the Three Stages of a Single DAC Excitation
For both technologies, 0.1 Hz AC VLF equipment is used as the HV source. In the VLF-PD test, the sinusoidal 0.1 Hz wave is used, while the damped AC-PD test uses a cosine rectangular 0.1 Hz wave to generate the damped AC voltage to excite the cable and measure the PD activity.
A power frequency range of 20–300 Hz has proven very reliable in AC hipot and PD testing on high-voltage transmission cables for decades. The damped AC voltage creates similar PD behavior when compared to AC voltage in the power frequency range. The DAC characteristic wave shape is generated by applying very-short, non-continuous voltage from a negative or positive maximum voltage level and exhibits a damped sinusoidal oscillation around the zero level (Figure 5), which is caused by losses in the cable insulation.
The similarities between the damped AC and the AC power frequency voltages have proven to produce similar characteristics for PD test results.
To perform an offline PD test with either of these two technologies, the cable is disconnected from the network. To avoid PD activity during the test from external sources, both ends must be isolated from any device (e.g. lightning arrestors). A separate power source and a coupling capacitor or sensor are connected to the near end of cable under test as shown in Figure 6, and the voltage is increased from 0.5 times rated voltage to 2 times rated voltage for new cables, or up to 1.7 times rated voltage for aged cables. The PD activity in the cable under test is detected, and the spot or spots causing the PD are localized and mapped.
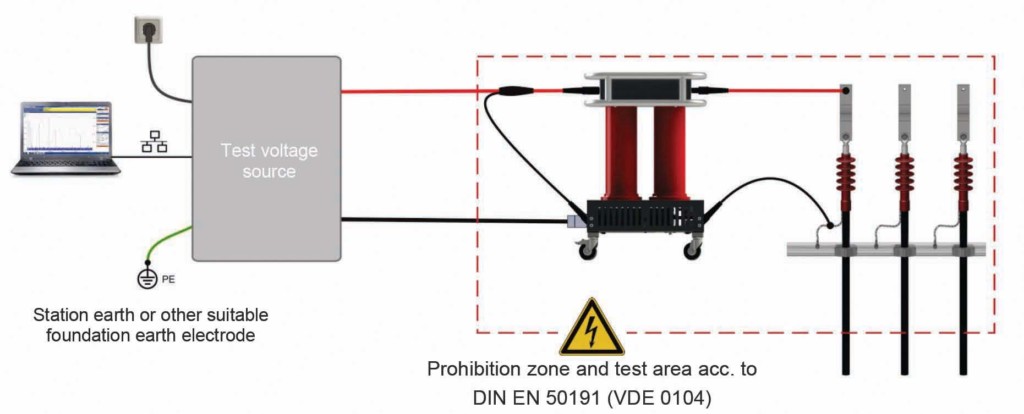
Figure 6: Connection of PD Test Equipment
Offline PD Technologies
The IEEE 400.3 Guide for Partial Discharge Testing in Power Shielded Cables in a Field Environment and IEEE 400.2 IEEE Guide for Field Testing of Shielded Power Cable Systems Using Very Low Frequency (VLF)(less than 1 Hz) provide guidance for offline PD tests using VLF-PD (sinusoidal wave shape at 0.1 Hz) and DAC PD (sinusoidal wave shape at power frequency) technologies. Both methods are typically compliant with IEC 60270. IEEE 400.4 provides additional guidance for application of the damped AC (DAC) wave shape.
The inception voltage and extinction voltage of a PD defect are two very important parameters to characterize the severity of a PD defect. The inception voltage for certain types of defects depends on the frequency of the applied test voltage of the selected PD test method. PD defects in devices like splices and terminations, which employ stress cones to change the characteristics of the electrical field (voltage gradient), will show lower PD inception voltages for PD test methods operating in the power frequency range compared to the sine 0.1 Hz AC (VLF) values. This can be problematic when inception voltages measured using 0.1 Hz VLF equipment are well above the operating voltage levels of a cable. This suggests safe operation of the cable under operating conditions when — in reality — PD is already present at or below operating voltage levels. In this situation, PD equipment that operates within the power frequency range will detect the correct inception voltage and identify the circuit as potentially compromised depending on level of PD level detected.
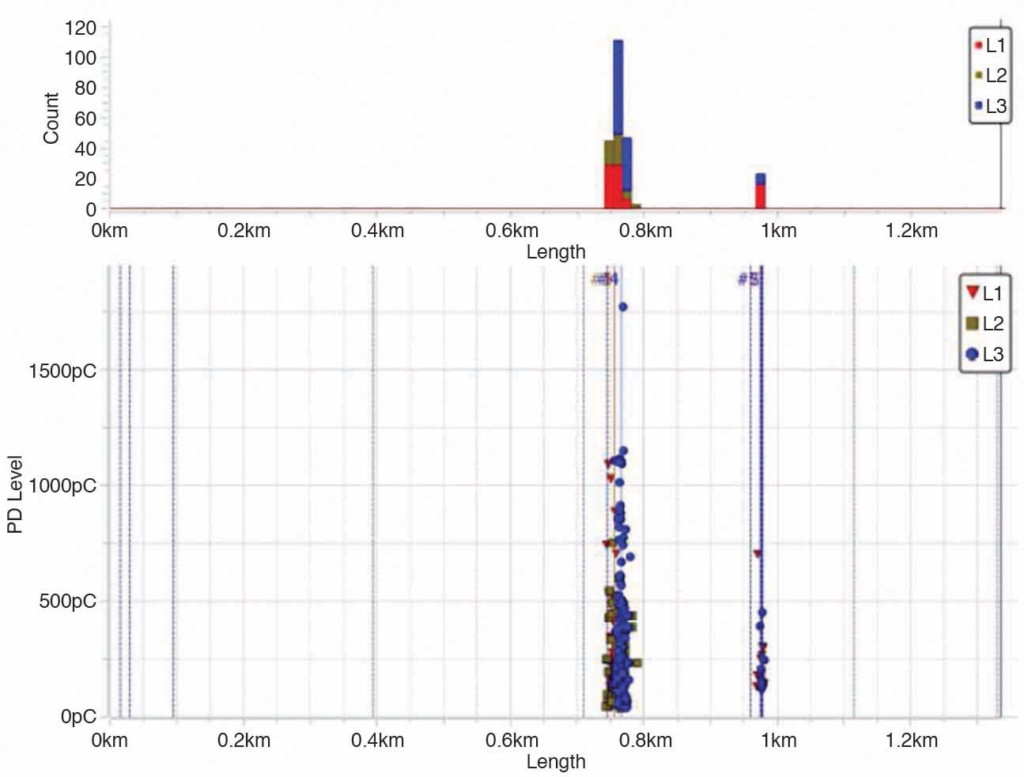
Figure 7a: Strong PD Activity with DAC Technology @Uo
Figure 7a shows very strong PD activity in a cable at operating voltage Uo when using DAC technology; however, when applying 0.1 Hz Sine wave technology (Figure 7b), no PD could be identified at operating voltage Uo.
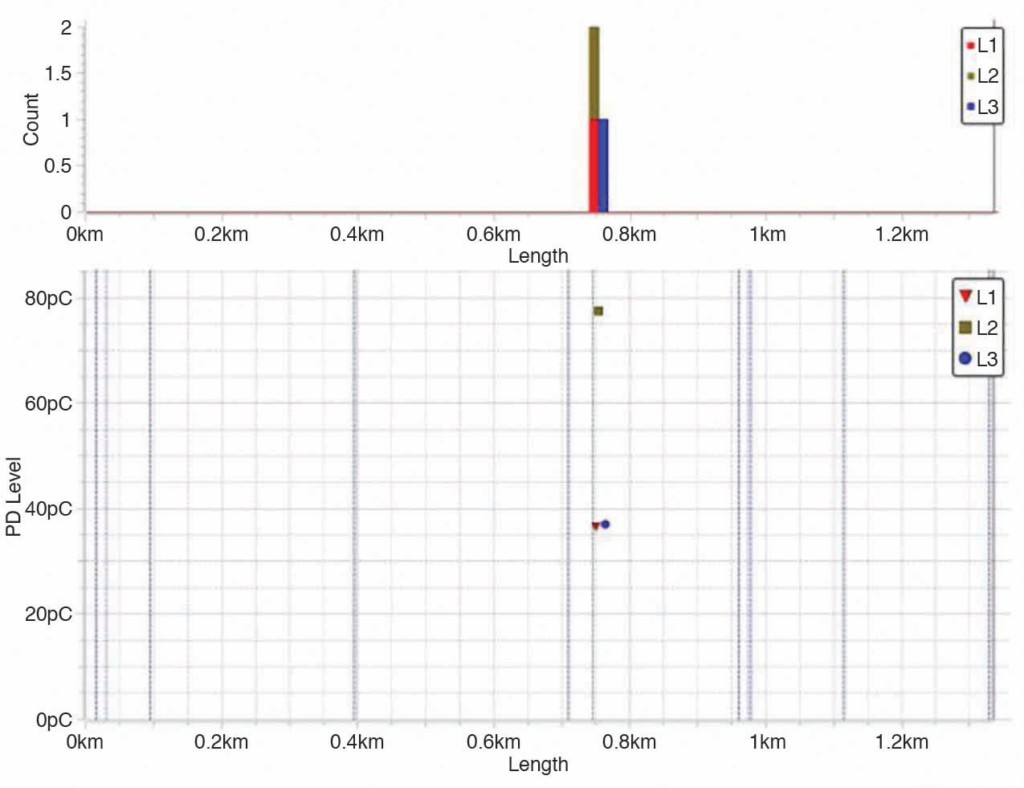
Figure 7b: No PD Activity with 0.1 Hz sine Technology @Uo
PD Field Test in a Wind Farm
The next field measurement example provides a good example of how the PD test can help detect incipient problems with the DAC technology (power frequency range) that are not apparent with either of the 0.1 Hz AC VLF technologies.
The test was performed at a wind farm that experienced splice failures. The previously performed VLF withstand test had not been able to detect the problematic splices by failing them during a commissioning test. Therefore, the wind farm operator performed a DAC PD test of the cables. Figure 8 shows a PD test performed on a 6.5-km-long XLPE cable. The graph shows PD activity in all three phases. In phase A (red dots), the PD activity was due a non-PD free connection between the equipment and phase A and was therefore discarded. In phases B (blue triangles) and C (orange squares), PD activity was observed at 1.8 km with levels around 20 nC.
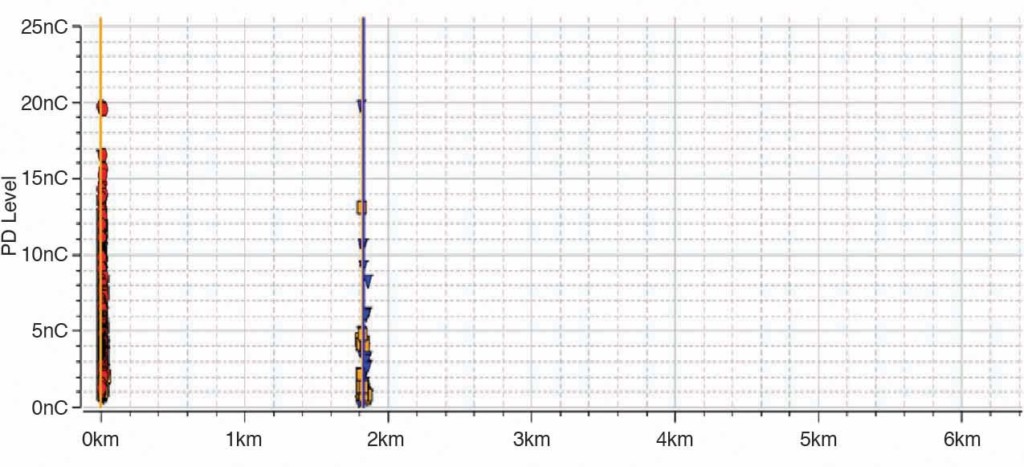
Figure 8: PD Activity Detected at 0≤ U ≤1.7 in Phases B and C
The cable had a joint in all three phases at 1.8 km. The splice was opened in phase B and later in phase C, and visual inspection revealed that no sealing mastic had been used in the mechanical connector screw housings in phase B, with the same result in phase C.
Conclusion
Over the last 40 years, the VLF withstand test has proven its effectiveness and value to detect defects and severe workmanship problems by failing them during the test. Although workmanship issues in new cables can be detected (failed) by a VLF withstand test if they are very severe, lesser problems will not fail under withstand test conditions. However, the PD test, especially when performed within the power frequency range like the DAC PD, is an excellent method to detect and localize even very small workmanship issues (incipient defects) in new cables during the commissioning test.
Today, the monitored withstand test as suggested in IEEE 400.2 may represent the best available test method for commissioning new cables. The withstand test component stresses the cable for mechanical damage like cuts, nicks, and kinks that occurred during laying and/or trenching, and the PD component checks for workmanship issues in accessories.
References
IEEE 400.2, Guide for Field Testing of Shielded Power Cables Systems Using Very Low Frequency (VLF) (less than 1Hz).
IEEE 400.3, Guide for Partial Discharge Testing of Shielded Power Cable Systems in a Field Environment.
IEEE 400.4, Guide for Field Testing of Shielded Power Cables Systems Rated 5kV and Above with Damped Alternating Current (DAC) Voltage.
Oetjen, Henning. “Principals and field experience with the 0.1 Hz VLF method regarding the test of medium-voltage distribution cables,” Conference Record of the 2004 IEEE International Symposium on Electrical Insulation, Indianapolis, IN, USA, 2004, pp. 376-379, doi:10.1109/ELINSL.2004.1380602.
Jäverberg, Nadejda and Hans Edin. “Applied voltage frequency dependence of partial discharges in electrical trees,” Proceedings of the 21st Nordic Insulation Symposium 2009.
Yan, Biao, Li Zhou, Jie Chen, Feng Bo Tao, and Jian Zhang. “Testing and Diagnosis of Extra High Voltage Power Cables Using Damped AC Voltages Combined with Distributed Partial Discharge Measurement.” Advanced Materials Research 1070–1072 (December 2014): pp. 1039–1043. https://doi.org/10.4028/www.scientific.net/amr.1070-1072.1039.
IEC 62067-2011, Power Cables with Extruded Insulation and their accessories for rated voltages above 150 kV (Um=170kV) up to 500 kV (Um=550kV) – Test methods and requirements.
 Javier Ruiz is Megger’s fault location, test, and diagnostics sales manager for Mexico and East Canada. His focus is training end-users on the theory and correct use of cable infrastructure equipment. Javier initially worked as a field support engineer for the former HDW Electronics, a power cable fault location and testing company, before joining Megger in 2012. He earned a BS in engineering at Autonomous University San Luis Potosi in Mexico specializing in instrumentation and control.