

Partial discharge (PD) testing is routinely used on all types of medium- and high-voltage equipment as a factory quality assurance test for electrical insulation and as a tool to detect deterioration in the electrical insulation of operating equipment. Today, dozens of vendors supply PD instruments, but the first PD tests were made by researchers over a century ago in an effort to understand PD. This article traces some of the key developments that led to the current state of this technology and outlines some of the challenges with PD testing, such as measuring PD during high-voltage DC tests and short-rise-time impulse voltage tests.
Partial discharges (PD) are small electrical sparks that can occur in the insulation systems of medium- and high-voltage electrical equipment, including power cables, transformers, switchgear, and stator windings. In most equipment, the occurrence of PD indicates that the equipment may fail soon since PD acting on organic insulation such as polyethylene, epoxy, oil, and/or paper quickly degrades the insulation. In some cases, PD indicates another problem, such as a poor electrical connection in a transformer or loose coils in the slot in a motor stator.
For decades, PD testing (also called corona testing) has been a required factory acceptance test for many types of equipment. More recently, off-line and on-line PD testing have become valuable tools to determine when maintenance or replacement may be needed in equipment that has been installed and operated.
Today, PD testing in OEM and end-user facilities is widely applied, but this was not always the case. Research on how to measure the current pulses associated with PD evolved as electronic hardware and software tools advanced.
This article reviews some of the key developments and credits some of the important researchers. Further details and more references can be found in Chapter 1 of a recently published book on PD measurement.[1] This article also provides information on measuring PD in DC equipment and energized apparatus with short-rise-time impulse voltages, which are the focus of research today. We do not discuss PD measurement using acoustic, ultraviolet, or chemical test methods here. See Stone et al[1] for more information on these methods.
EARLY HISTORY
PD testing dates back to the 1910s when, in one of the first English-language papers, Prof. Edward Bennett used a coupling capacitor with an oscillograph to measure PD from high-voltage transmission line equipment. The oscillograph is a relatively fast-responding electromechanical device like an X-Y chart recorder. Between 1910 and 2023, more than 8,200 papers on PD and corona measurement on HV equipment have been added to the IEEE and IEE/IET databases alone.
A review of a sampling of these papers reveals five distinct areas of development for PD measuring equipment:
- Radio interference voltage (RIV) frequency domain methods
- Time domain analog detection up to 1 MHz using oscilloscope displays
- Transition to digital detection
- Measurement of PD at frequencies from a few MHz to the GHz range
- Computer-based processing
RIV Testing
RIV testing was the first widely applied method to measure PD, although that was not the original purpose of the test. RIV is variously defined as radio influence voltage or radio interference voltage. The original purpose of this test was to determine the level of corona interference (in microvolts) that an overhead transmission line or its associated insulators or transformers produce in AM radio receivers. If the RIV level is too high, complaints from the general public about poor analog radio and analog TV reception could be expected. The PD sensor was an antenna or some type of coupling capacitor. The signals were measured by a specialized radio receiver (sometimes called a radio noise meter), usually with a center frequency of about 1 MHz (within the normal AM radio broadcast band) with a narrow bandwidth of about 10 kHz. The instrument’s output was a meter that displayed the quasi-peak, which was the weighted level of the electrical noise produced by the PD activity. In addition, a demodulated signal from the corona could be listened to on a speaker or headphones.
Although early receivers were made by researchers, commercial RIV instruments were eventually made by Stoddart Aircraft Radio Co. in the USA in 1944 (Figure 1) and by Siemens in Europe, among others. In 1940, the National Electrical Manufacturers Association (NEMA) published NEMA 107, Methods of Measurement of Radio Influence Voltage (RIV) of High Voltage Apparatus, a standard test method for measuring RIV that is still in print.
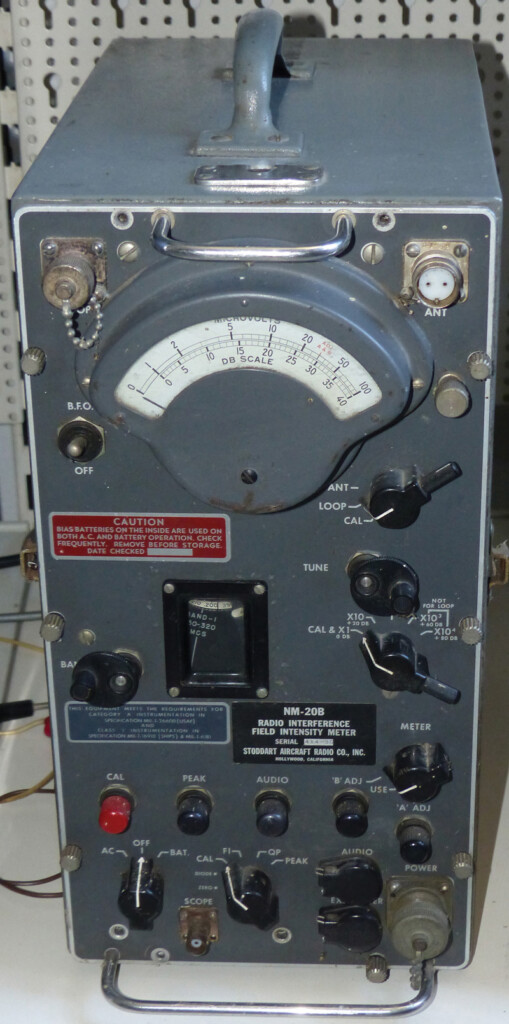
Photo Courtesy Michael Heller, Das Rundfunkmuseum, Cham, Germany
Radio noise meters fundamentally measure corona from transmission lines, but researchers began using RIV methods to detect PD in oil-paper-insulated power cables and oil-filled power transformers. In 1924, W. Del Mar applied RIV detection to measure the PD in oil-impregnated cables to determine the maximum design electric stress for the insulation by measuring the PD inception voltage.[2] In 1965, at least two papers described PD measurement in power transformers for factory QA testing using the RIV method following NEMA Standard 107, which is revised periodically. The PD sensor was often the capacitance tap on the transformer bushing, normally used to measure the transformer voltage. In Chapter 6 in the Bartnikas/McMahon book on corona,[3] Dr. Thomas Dakin from Westinghouse suggested that the RIV type of PD test was still the most common type of factory PD test for transformers up to at least 1979 when the book was written.
Although not widely recognized at the time, John Johnson of Westinghouse made a critical advance in the late 1940s with the application of RIV testing to on-line insulation condition assessment.[4] We believe these were the first on-line measurements not intended to measure radio interference from transmission lines. PD pulses were initially detected across a resistor between the stator neutral and ground using an early oscilloscope or noise meter to measure the signal.
In the 1980s, Jim Timperley adapted the original RIV method to on-line generators, together with Johnson’s neutral detection.[5] Instead of measuring the PD level using a noise meter, he used a specialized radio receiver commonly used for electromagnetic compatibility applications (i.e., measuring the RF signals emitted by electronics, power supplies, etc., to ensure they did not cause other equipment to malfunction). These commercial instruments, which are close cousins of RF spectrum analyzers, produce a plot of RF signal magnitude in µV vs. frequency. He initially explored frequency ranges up to a few MHz, but later expanded the range up to 100 MHz. The PD sensor was usually a high-frequency current transformer (HFCT) mounted on the generator neutral. Timperley preferred to call this version of the RIV test the electromagnetic interference (EMI) test. There are many ways to estimate peak PD activity; Timperley used the definition of quasi-peak in the IEC/CISPR 16-1 standard. The test is still performed by a few utilities today, although some have rebranded EMI testing as an electromagnetic signature analysis (EMSA).
Time Domain Analog PD Detection Using Oscilloscope Displays
The time domain method of PD current pulse measurement uses analog electronics and displays the PD on an oscilloscope to compare PD pulses to the 50- or 60-Hz AC cycle. PD current pulses occur in specific regions of the AC cycle depending on its cause and/or location within the insulation system.[1,3] The modern (at that time) PD instrument depended on the development of better oscilloscopes. The oscilloscope can trace its history back to the development of the cathode ray tube (CRT) by Nobel Prize winner Dr. K.F. Braun of Germany in 1897. His CRT was used by many researchers in the early 1900s to visualize the voltage and current waveforms of discharges.
Many researchers made improvements to CRTs over the decades, but it wasn’t until Tektronix invented the Tek 511 oscilloscope in 1946 that oscilloscopes became externally triggered, calibrated, easy-to-use devices for PD research. The Tek 511 could record signals up to 10 MHz, which corresponds to a 30 ns pulse rise time. This led to the belief that PD pulses had rise times of several tens of nanoseconds instead of a few nanoseconds or less as is known today.[1] It was logical that specialized oscilloscopes became incorporated into the first commercial PD instruments.
COMMERCIAL PD MEASUREMENT
Commercial PD measurements in the time domain using an oscilloscope display started in the 1950s with the work of Dr. George Mole of the British Electrical Research Association (ERA). Mole produced a PD measuring system including a 1 nF high-voltage PD coupler, a detection impedance using RC or RLC components, a method of synchronizing the PD to the AC cycle, analog filters, and a display based on a cathode ray tube.[6] A feature of the display was the use of an ellipse (Lissajous figure) to display the 50 or 60-Hz AC waveform. This allowed a single-channel oscilloscope to display the AC voltage and the PD in a single trace, as well as effectively doubling the sweep time base compared to a conventional horizontal oscilloscope time base. That is, the effective sweep speed was 1 ms/division, instead of 2 ms/division with a conventional 50- or 60-Hz sine wave, enabling the very short-duration PD pulses to be more easily seen compared to the AC cycle. The Mole instrument, and later versions up to the ERA Model 5, were manufactured by Robinson Instruments in England. Figure 2 shows the ERA Model 3 and the AC voltage ellipse on which the detected PD pulses are superimposed.
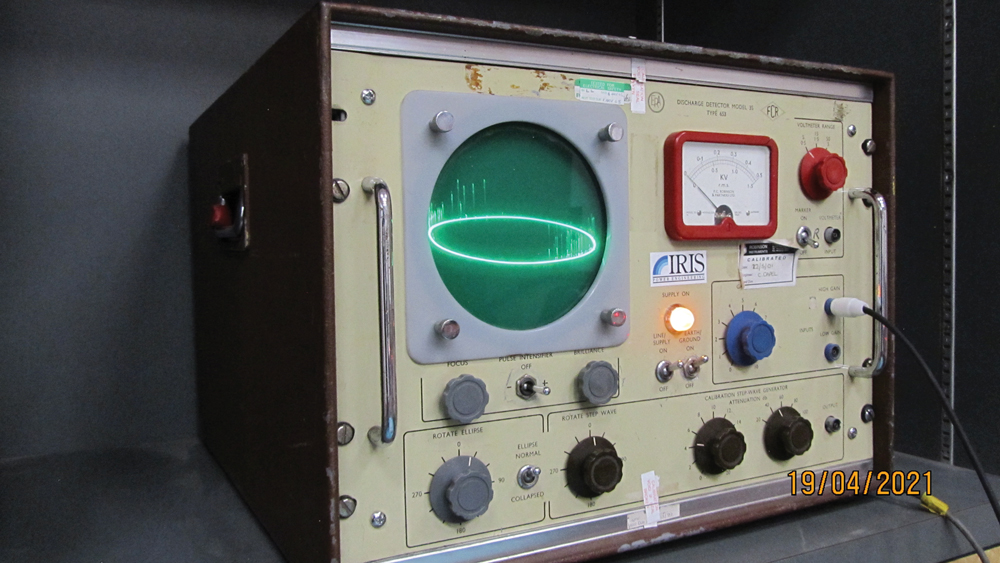
Photo courtesy Mladen Sasic, Iris Power L.P.
After the commercial success of the early ERA detectors, many companies around the world made similar devices including Biddle Instruments (now part of Megger) and Hipotronics (now part of Hubbell) in the USA and Tettex Instruments (now part of the Haefley/Pfiffner Group) in Switzerland. This generation of PD detectors worked in what became the IEC 60270 frequency range (up to about 1 MHz). In contrast to RIV methods, these detectors could display PD pulses on an oscilloscope screen with selectable narrowband or wideband frequency ranges. These analog instruments could accommodate a wide variety of coupling capacitors and test object capacitance, usually with various impedance matching units (sometimes referred to as quadrupoles) having different resistance, capacitance, and inductance (if present). The output was an oscilloscope screen as well as a meter that recorded the peak (or quasi-peak) PD magnitude. Permanent recordings of the oscilloscope screen were made with a Polaroidinstant camera, and the magnitude of individual pulses was estimated using a ruler.
In the 1950s, the availability of commercial PD instruments led to an explosion in applications for all types of high-voltage equipment. One of the pioneers of this new era was Prof. Frederik Kreuger of Delft University in the Netherlands. His PhD work led to the 1965 publication of the first English-language book about PD measurements. After a short stint at ASEA in Sweden, Kreuger worked for Dutch cable manufacturer Nederlandse Kabelfabriek for most of his career. Kreuger, who died in 2015, investigated various PD detection methods and their sensitivity, did research on the best PD detection methods for each type of HV equipment (especially power cables), and developed what is now known as the Kreuger PD bridge to suppress disturbances. Reasoning that how quickly PD would cause cable insulation to fail would depend on the number of electrons bombarding the insulation, he explored how to calibrate the detected signals from mV into apparent charge (pC). His work led directly to the development of the first international standard for application to PD measurements: IEC 270, Partial Discharge Measurements, which was superseded by IEC 60270, High-Voltage Test Techniques — Partial Discharge Measurements, in 1968.
Another leading researcher in this era was Dr. Ray Bartnikas. Like Kreuger, Bartnikas began his career with a cable manufacturer, Northern Electric in Canada, before continuing his research into PD measurement at the utility Hydro-Québec’s Research Institute (IREQ). Bartnikas investigated optimal methods and limitations for calibrating PD in terms of apparent charge and was key to the effort to develop ASTM D1868, the first American standard on PD detection, in 1973. Bartnikas also edited a book on PD measurement and interpretation,[7] published in 1979, that is still in print. Bartnikas, who died in 2022, was also active in the digital era with the development of PD pulse magnitude analyzers.
The research of Kreuger and Bartnikas, together with the commercial availability of relatively portable PD measuring systems, led to the widespread application of PD measurement in factories for quality assurance testing of HV equipment as well as in research applications. By the end of the 1960s, virtually every manufacturer of HV equipment, plus every high-voltage laboratory, had at least one of these analog detectors. The instrument shown in Figure 2 was owned and used by the former British utility CEGB until Iris Power acquired it in the 1990s for its museum. The oscilloscope screen shows the typical elliptical trace of a 60 Hz sine wave with PD from a superimposed twisted pair of insulated wires.
Digital PD Detection
Research into digital techniques to measure PD mainly started with Bartnikas and his pulse magnitude analyzer in 1969.[8] These early digital circuits used discrete transistors to segment the pulse magnitudes into several magnitude bins (or magnitude windows), and then count the number of pulses in each bin over a set time interval. In Figure 3, the output was a two-dimensional plot of pulse magnitude (horizontal scale) vs. a usually logarithmic vertical scale of pulse count rate (number of pulses per second per magnitude window).
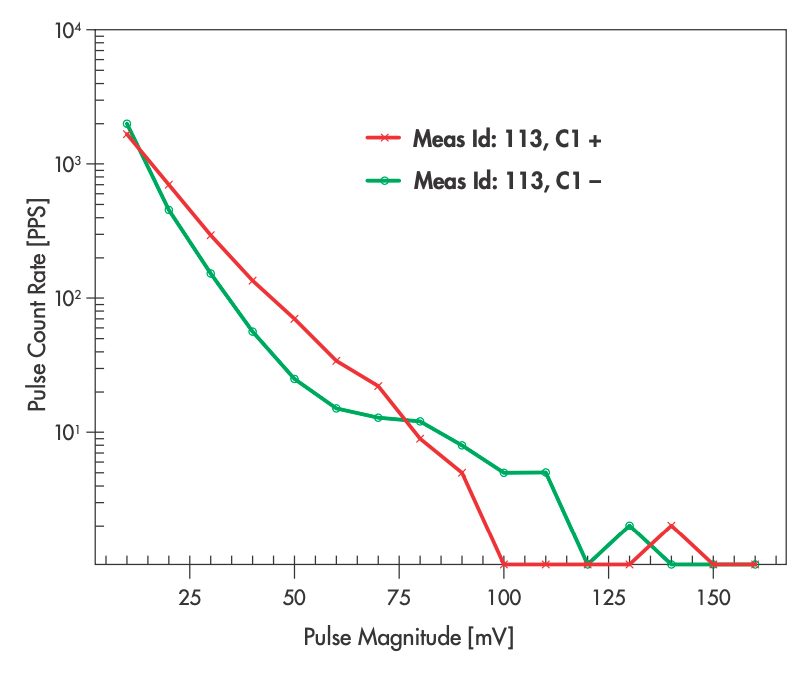
Photo courtesy Iris Power L.P.
Another important step was taken independently in 1976 by Dr. Andreas Kelen of ASEA in Sweden and Professors Austin and James in the UK.[9,10] They combined homemade, pulse-pulse-counting electronics with the digital computers then available to count not only the number of pulses per magnitude window but also the pulses at different parts of the AC cycle. Many such research instruments that could record the number and phase position of the PD pulses were described in the 1980s. In 1988, Bernhard Fruth and colleagues from ABB Corporate Research in Switzerland developed a system called phase-resolved partial-discharge analyzer (PRPDA) using the IEC 60270 frequency range. They were probably the first to use the term.[11] The PRPD plot has now become a quasi-standard two-dimensional color-map display of the three-dimensional matrix of PD pulse magnitude (vertical or y-axis) vs. AC phase position (horizontal or x-axis) vs. pulse count rate (z-axis) represented by changes in pixel color. An example is shown in Figure 4.
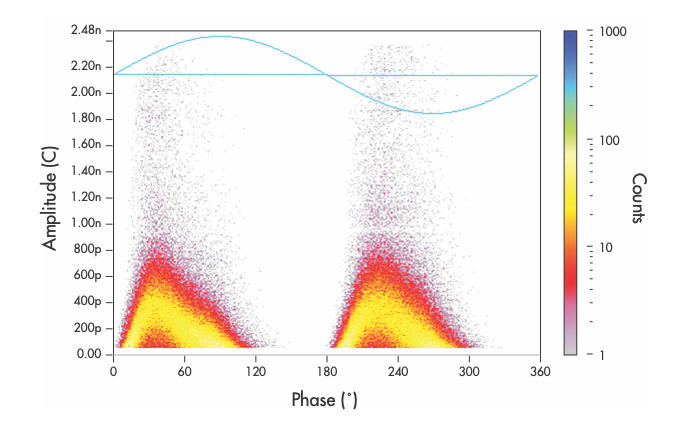
Image courtesy of Iris Power L.P.
The number of pulses recorded in each magnitude and phase window is shown as a color (the color key is shown on the right). This data was collected by a commercial detector working in the IEC 60270 frequency range (i.e., less than 1 MHz).
One of the first widely used commercial IEC 60270-compliant digital PD instruments was made by Power Diagnostix, which was founded in 1992 by Detlev Gross and Fruth. Fruth used his prototype PRPDA developed at ABB Corporate Research and worked with Detlev Gross, who had started his own electronics company in 1986, to develop the insulation condition monitor (ICM). After the Power Diagnostix (now part of Megger) ICM instrument was introduced, companies including Hipotronics, Lemke, OMICRON, TechImp, Tettex, and many others introduced similar IEC 60270-compliant instruments using mainly digital technology. G.C. Stone, A. Cavallini, G. Behrmann, and Claudio Angelo Serafino[1] provide further information on some of the methods used by commercial PD instruments to digitally capture and measure PD in the IEC 60270 frequency range. Very few analog PD instruments are currently being used due to the convenience and flexibility of digital PD instruments, as well as their ability to share data files with computers for display and data manipulation.
VHF and UHF PD Detection
The development of better oscilloscopes led to a better understanding of the nature of PD current pulses. Tektronix introduced the Tek 465 scope in 1972. Except for the cathode ray tube (CRT), it was among the first oscilloscopes to use solid-state electronics with a 100-MHz bandwidth. Of special importance for PD measurement was the introduction of a Tek 466 single-shot analog storage oscilloscope in 1972. The Tek 466 had a 100-MHz bandwidth, so it could display a single PD pulse with a rise time as short as about 4 ns. The development of the analog Tek 7104 oscilloscope in 1978 allowed the PD current pulses to be accurately recorded for the first time since it had a bandwidth of 1 GHz (corresponding to a 0.3 ns rise time), and its microchannel image intensifier plate made clear photographic recordings of single PD current pulses possible for the first time. With each increase in oscilloscope bandwidth up to the 1-GHz range, the rise time of the PD current pulses was found to be shorter than previously believed.
The realization that PD contained frequency components up to 1,000 MHz led many researchers to investigate PD measurement in the VHF (30–300 MHz) and UHF (300–3,000 MHz) frequency ranges. Measuring PD in the higher frequency ranges reduced the risk of false indications from the severe electrical interference that is typically found in on-line PD measurement and directly led to the widespread use of on-line PD measurement in GIS, transformers, and rotating machine stator windings.[1]
The development of 1-GHz oscilloscopes in the late 1970s led to a tremendous amount of work on PD pulse shape. In 1982, the theoretical foundation for PD measurement above the IEC 60270 frequency range was presented by Dr. Steven Boggs, who worked for the utility Ontario Hydro in Canada and continued his research at the University of Connecticut in the USA.[12] Boggs recognized that what he called ultrawide-band (UWB) PD detection with a sensor close to the PD site would have superior ability to suppress interference, especially during on-line PD measurements. He and his colleagues first applied VHF and UHF detection of PD to gas-insulated switchgear (GIS) and rotating machine stator windings. They recorded the pulse shapes from many test objects and defects. These included PD pulses recorded from electric trees growing in epoxy, which had rise times of about 500 ps and a pulse width of 1.5 ns (full width, half maximum). Boggs used various types of capacitors and antennas to achieve a bandwidth of several hundred MHz in GIS. In 1991, Dr. Brian Hampton and his colleagues at the University of Strathclyde in Scotland published the design of a practical PD sensor for GIS combined with a continuous UHF PD monitoring system. The sensor was a circular plate installed on the inside surface of GIS maintenance hatch covers (inside the GIS enclosure). These acted as near-field antennas to pick up the electric field of the PD pulse as it passed through the coaxial waveguide formed by the GIS. Similar UHF sensors are now widely installed in GIS and large power transformers.
In the late 1970s, Stone (who in 1990 co-founded Iris Power, now part of Qualitrol Corp) and his colleagues at Ontario Hydro Research began measuring PD in the 30–300-MHz range in operating generators.[13] The advantage of the VHF frequency range is that the high-voltage PD couplers could be much smaller (80 pF) and thus fit within the generator frame. The time-of-arrival principle could be used to separate stator PD from power system disturbances using a pair of sensors per phase.[1] In addition, disturbance suppression based on digital rendering of the pulse shape was possible.[14]
In the late 1980s, Ross Mackinlay and his colleagues at EA Technologies (originally the Electricity Council Research Centre) in the UK introduced a different type of VHF sensor they called the transient earth voltage (TEV) sensor[15] that detected voltage transients from PD within medium-voltage metal-clad switchgear that would leak out at vents or door edges to create pulses on the outside metal panels enclosing the switchgear. The transient could be detected at a capacitive probe placed against the surface of the switchgear. Together with suitable instrumentation, this technology is now widely applied for on-line PD detection in metal-clad switchgear.
From a commercial point of view, the extension of PD instruments to frequencies higher than 1 MHz (in what is now termed an IEC TS 62478-compliant PD instrument) began in 1986 when FES International (later known as Adwel and now part of Iris Power L.P.) introduced an instrument called the PDA-H to measure PD in operating hydro generators in the VHF range (Figure 5). The PDA-H measured the PD from a pair of permanently installed 80 pF couplers in each phase of an operating hydro generator. The instrument was controlled by an early PC, which also served as the display device.
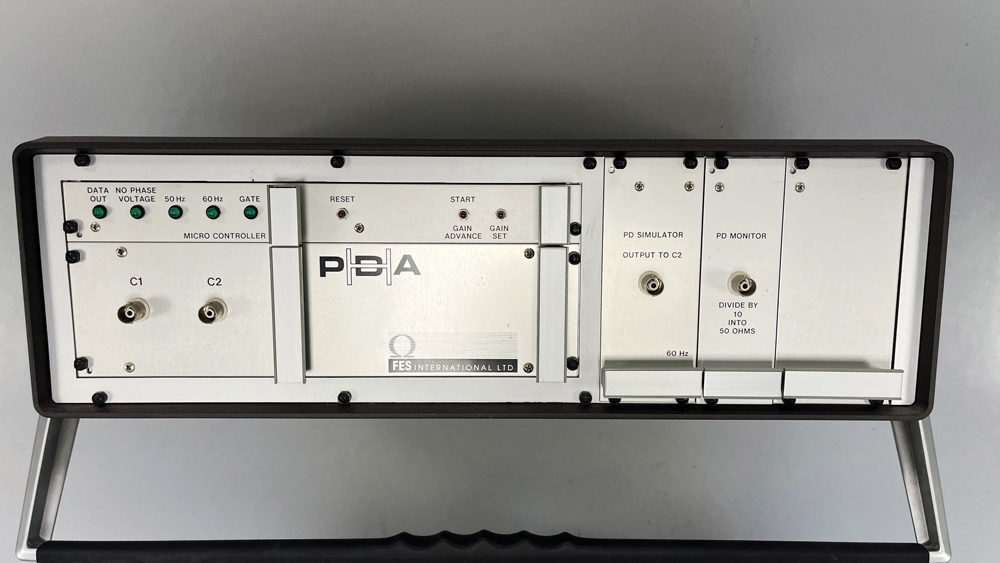
Photo courtesy Mladen Sasic, Iris Power L.P.
In 1991, Iris Power introduced the PDA-IV, an all-digital instrument working in the VHF range that separated power system disturbances from stator winding PD on a pulse-by-pulse basis and displayed PRPD plots on a built-in LCD. A year later, they introduced the TGA-S, which worked in the UHF range with a special electromagnetic coupler called a stator-slot coupler (SSC) installed in hydrogen-cooled turbine generators. A UHF all-digital continuous PD monitor for GIS was introduced by DMS. Now a part of Qualitrol Corp, DMS was founded by John Pearson, Brian Hampton, and Owen Farish of Strathclyde University in 1994, and the PD monitor was based on the technology they developed at the university. This was also the world’s first commercial continuous on-line PD monitor.
Today, there are dozens of companies making VHF and UHF PD instruments, most of which are used for on-line PD monitoring.
Post-Processing Signals
Digital PD instruments facilitated an interface to computers, which lead to the development of software tools to analyze PD data. These tools use signal magnitude, phase position, count rate, and applied voltage at the time of the pulse to calculate various indicators of PD activity (quasi-peak magnitude, PD power, PD current, quadratic rate, etc., as outlined in IEC 60270) after the data has been stored in memory. This post-processing can help separate interference pulses from test-object PD pulses and aid in identifying the causes of PD in a test object. This was important since as PD technology spread from research/high-voltage test labs to HV equipment owners and testing service companies, PD test equipment users wanted to be able to interpret PRPD patterns without having to be experienced PD researchers.
In 1986, the first notable contribution in post-processing was made by Dr. Tatsuki Okamoto and Dr. Toshikatsu Tanaka of CRIEPI in Japan, who applied statistical analysis of the PD patterns concerning the AC phase angle. A few years later, Prof. Edward Gulski of Delft University also used statistical methods based on normal distribution to analyze PRPD patterns. This work was eventually commercialized in a Haefely PD detection system. Prof. Alfredo Contin (University of Trieste) and Prof. Gian Carlo Montanari (University of Bologna) applied statistical analysis to PRPD pattern analysis using the Weibull probability distribution. In all these early examples, the idea was to classify various PRPD patterns to determine the root cause of the PD. Although such techniques are not widely used today, they were the forerunners of other methods that have gained popularity.
In 2004, Andrea Cavallini and his colleagues at the University of Bologna and the University of Trieste in Italy were likely the first to use non-statistical post-processing methods to separate pulses of different shapes — a key step to suppress disturbances, as well as to identify different types of PD sources (e.g., differentiate void PD from surface PD). They developed what is known as the time-frequency (T-F) map method.[16] Each pulse after A/D conversion was processed into the frequency domain at the same time as an indicator of pulse length was captured. A map was created with two axes (time and frequency) with the transformed pulse shape and frequency of each detected pulse. Cavallini discovered that disturbances and different types of PD sources tended to cluster in different regions of the T-F map. The clusters can be identified by a skilled observer or using specialized pattern-recognition algorithms. In many cases, each cluster had a unique PRPD pattern, and with experience, the patterns could be associated with different defects or disturbance sources. The technology was first applied to power cables and then spread to other types of HV equipment. This post-processing technology led to the founding by Montanari and his colleagues of TechImp (now part of Altanova/Doble).
Another commercial post-processing method was developed by Prof. Ronald Plath, Caspar Steineke, and Harald Emanuel at MTronix (now part of OMICRON). The key feature of this post-processing method is to simultaneously capture the signals from all three phases.[17] The response to an event (a PD pulse or an interference pulse) on all three phases is measured and correlated on a three-dimensional plot of the pulse magnitude in each phase. The 3PARD plot consists of thousands of pulses. Various types of PD and interference create clusters in different regions of the diagram. As with the T-F method, clusters are identified, and they usually display a unique PRPD pattern that identifies the nature of the interference or PD sources. The method was first applied to off-line power transformer testing (which requires a three-phase test set to energize the transformer), then deployed for on-line transformer monitoring. Most recently, it has been extended to on-line monitoring of stators windings, GIS, and power cables.
The MTronix device was further specialized by developing band-pass digital filters able to process the PD pulses in real time. By selecting three different filters, maps similar to the 3PARD plot can be achieved, leading to the separation of PD pulses based on their features in the frequency domain.
In addition to these post-processing methods, many other signal-processing methods have been applied, often using various forms of artificial intelligence or fractal analysis. To date, this work is primarily experimental and has not been widely applied in practical PD measurements.
CURRENT DEVELOPMENTS
Although plenty of evolutionary developments are still occurring for on-line PD testing of 50/60-Hz electrical equipment, most of the main innovations today are concerned with measuring PD in HVDC equipment and equipment within or connected to modern inverters.
The HVDC application is due to the widespread installation of long, transmission-class DC power cables for submarine links and offshore wind turbines. PD in DC applications is fundamentally different from that in AC applications since PD occurs infrequently, and of course, it cannot be displayed against the 50/60 Hz (or other AC frequency) in a PRPD plot. Although IEC 60270 does discuss DC PD measurement, there is still no widely adopted method of collecting and analyzing the data. A summary of the current status of PD measurement technology in DC applications can be found in G.C. Stone, et al.[1]
The other very active area for PD detection technology concerns inverters, cables, and motor windings associated with variable-speed drives. Modern drives mainly use voltage source inverters (VSI) that create thousands of short-rise-time voltage impulses per second. Even in relatively low-voltage applications (400 V and above), these voltage impulses are known to cause PD that can lead to rapid failure of switching modules, power cables, and stator windings.[1]
The main technical issue is separating PD from the comparatively very-large switching voltage transients. In the past, VSIs used IGBTs as the switching device, which produced voltage impulses as short as 100 ns or so. Various VHF and UHF electromagnetic antennas were developed to detect PD while suppressing the switching transients. Such couplers have been implemented in modern voltage surge testers made by Schleich and Baker Instruments (now Megger), among others. However, as new switching technologies based on SiC and GaN field-effect transistors are being commercially introduced (especially in VSIs supplying electrical vehicle and aircraft motors), voltage transients have rise times as short as 10 ns or so. This is very close to the rise time (and frequency content) of the PD impulses themselves, making it challenging to extract the PD from the transients.
CONCLUSION
Historical review is always somewhat subjective. However, we have tried to summarize the key technical advances and companies that have pioneered the development of PD measurement technology. This technology is now widely applied for on-site, off-line, and on-line PD measurement. Although PD measurement technology is now advancing at a modest pace in 50/60 Hz applications, rapid developments are expected in high-voltage DC and impulse voltage applications.
This article was adapted from Practical Partial Discharge Measurement on Electrical Equipment, a new book written by the authors and published by Wiley/IEEE Press. We would be grateful to be informed of errors or omissions in this article.
REFERENCES
[1] G.C. Stone, A. Cavallini, G. Behrmann, Claudio Angelo Serafino. Practical Partial Discharge Measurement on Electrical Equipment, Wiley/IEEE Press, 2023. [2] W. Del Mar, C.F. Hanson “High-Voltage Impregnated Power Cables,” Trans AIEE, June 1924, pp 947–957. [3] R. Bartnikas, E.J. McMahon. “Engineering Dielectrics, Volume 1: Corona Measurement and Interpretation,” ASTM Publication 669, 1979. [4] J. Johnson, M. Warren. “Detection of Slot Discharges in High-Voltage Stator Windings during Operation,” Trans AIEE, Volume 70, 1951, pp 1998–2000. [5] J.E. Timperley. “Incipient Fault Identification through Neutral RF Monitoring of Large Rotating Machines,” IEEE Trans PAS-102, May 1983. [6] G. Mole. “Design and Performance of a Portable AC Discharge Detector,” ERA Report V/T 115, 1952. [7] R. Bartnikas, E.J. McMahon. “Engineering Dielectrics Volume 1: Corona Measurement and Interpretation,” ASTM Publication 669, 1979. [8] R. Bartnikas and J.E. Levi. “A Simple Pulse-Height Analyzer for Partial Discharge Rate Measurements,” IEEE Trans. IM, Vol.IM-18, pp. 341–345, December 1969. [9] J. Austin and R. E. James. “On-Line Digital Computer System for Measurement of Partial Discharges in Insulation Structures,” IEEE Trans. EI-11, December 1976, pp. 129–139. [10] A. Kelen. “The Functional Testing of HV Generator Stator Insulation,” Cigre Paper 15-03, 1976. [11] B. Fruth, J. Fuhr. “Partial Discharge Pattern Recognition: A Tool for Diagnosis and Monitoring of Aging,” Cigre Paper 15/33-12, August 1990. [12] S.A. Boggs, G.C. Stone. “Fundamental Limitations in the Measurement of Corona and Partial Discharge,” IEEE Trans EI,
April 1982, pp 143–150. [13] M. Kurtz, G.C. Stone, D. Freeman, V. Mulhall, P. Lonseth. “Diagnostic Testing of Generator Insulation without Service Interruption,” Cigre Paper 11-09, August 1980. [14] S.R. Campbell, G.C. Stone, H.G. Sedding. “Application of Pulse Width Analysis to Partial Discharge Detection,” IEEE ISEI, Baltimore, June 1992. [15] R. R. Mackinlay. “Discharge Measurements on High-Voltage Distribution Plant,” IEE Colloquium on Developments Towards Complete Monitoring and In-Service Testing of Transmission and Distribution Plant, 1990, p 9. [16] A. Cavallini, M. Conti, A. Contin, G.C. Montanari, F. Puletti. “A New Algorithm for the Identification of Defects Generating Partial Discharges in Rotating Machines,” IEEE ISEI, September 2004, pp 204–207. [17] K.D. Plath, R. Plath, H. Emanuel, W. Kalkner. “Synchrone Dreiphasige Teilentladungsmessung an Leistungstransformatoren vor Ort und im Labor,“ ETG-Fachtagung Diagnostik elektrischer Betriebsmittel, Beitrag O-11, Berlin, 2002.

Greg Stone is a consultant specializing in electrical insulation testing. He was a Dielectrics Engineer with Ontario Hydro, a large Canadian power generation company from 1975 to 1990. From 1990 to 2021, he was employed at Iris Power L.P. in Toronto, Canada, a motor and generator condition monitoring company he helped to form. He has published two books on motor and generator winding maintenance and a book on partial discharge testing and authored more than 200 papers concerned with rotating machine windings. He has also been active in creating and updating many IEEE and IEC standards since 1980. Stone has a PhD in electrical engineering from the University of Waterloo and is an IEEE Fellow.

Andrea Cavallini is a full professor at the University of Bologna, Italy. His main research interests are partial discharge phenomena in power system equipment and electrical drives used for transport electrification. He is the co-author of more than 280 scientific papers and 15 international patents, co-founder of the University spin-off Techimp, and coauthored the book this article is based on. An IEEE Fellow, Andrea is active in the IEEE Dielectrics and Electrical Insulation Society (DEIS) as an Administrative Committee member, Transport Electrification Technical Committee Chair, Education Committee Chair, DEIS Italy Chapter Chair, and convener of CIGRE WG D1.43 and D1.74. He formerly represented Italy in SC D1. He is a member of IEC TC 2 MT 10 (Italian representative, project leader of IEC 60034-18-41 Ed. 2), and SAE.