
Power factor (PF) measurement has been performed on stator windings for many decades and is a widely accepted and recommended tool to assess the insulation system of individual bars/coils and for complete stator windings. The test is known to be sensitive to several global defects such as the degree of curing of the bonding materials, moisture ingress, contamination, and thermal aging.
In addition, the power factor tip-up variation of this test is commonly used to detect the void content of insulation. The power factor tip-up test compares the results of two PF measurements performed at two different voltages. Outside of North America, the PF measurement is often referred to as dielectric dissipation factor (DDF) or the tangent delta test, where the tangent of the loss angle is instead recorded. The difference between PF and DDF is negligible for values below 10%.
Two main standards specifically cover power/dissipation factor testing for rotating machines:
- IEEE Std. 286, Recommended Practice for Measurement of Power Factor Tip-Up of Electric Machinery Stator Coil Insulation
- IEC/TS 60034-27-3, Rotating Electrical Machines – Part 27: Dielectric Dissipation Factor Measurements on Stator Winding Insulation of Rotating Electrical Machines
Both offer useful information and guidance regarding the test procedure, test voltage, and data interpretation. One thing they have in common is that neither document provides absolute limits as pass/fail criteria for complete stator windings. This creates additional challenges for data assessment. Without pass/fail criteria, the test is classified as a diagnostic test, and the data must be analyzed and assessed with care. Typically, a combination of four parameters is used for the assessment:
- Variation of the PF values in time (trend evaluation)
- Change in power factor between two prescribed voltages (tip-up values)
- PF value at low voltage
- PF value at high voltage
This article reviews challenges that can be faced when performing an assessment of PF data on complete stator windings and will discuss the reason global absolute values should not be used. A modern approach to evaluate PD activity in stator winding from the PF data will also be discussed.
End-Potential Grading (EPG)
Rotating machines with a rated voltage of 6 kV and above usually have end-potential grading (EPG) tape or paint installed in the end-winding area. This material can be found under various names in the literature: Semi conductive grading, end winding stress grading, or EPG are only a few names; all indicate the same area. EPG is illustrated in Figure 1.
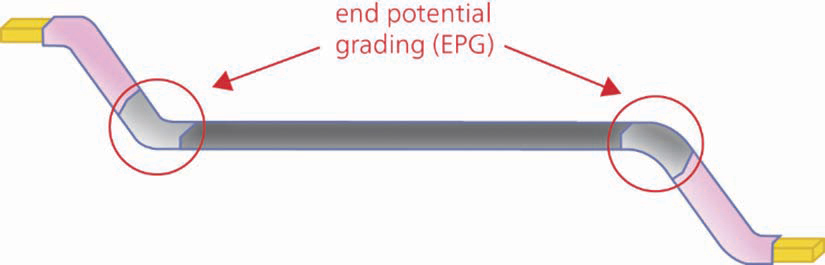
Figure 1: End-Potential Grading (EPG)
The purpose of EPG is to distribute electric field lines over a longer portion of the bars at the exit of the stator slots. Even if insulation is applied at the end-winding area, this area is at high-voltage potential due to the capacitive coupling between the conductor and the ground. Without EPG, a high local electric field would appear at the laminated core as shown in Figure 2. This would result in high partial discharge (PD) activity.
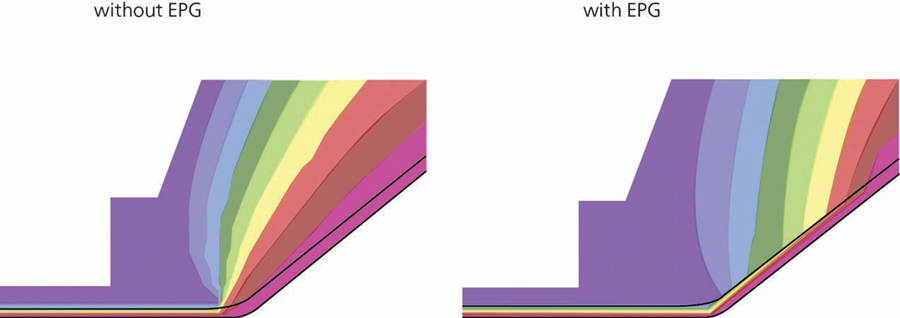
Figure 2: Electric Field Distribution: (left) without EPG, (right) with EPG
Currently, silicon carbide (SiC) is the primary component of EPG and is responsible for its grading properties. The conductive behavior of EPG is voltage-dependent and non-linear. When voltage is increased, the SiC layer becomes more and more conductive, resulting in a behavior shown in Figure 3.
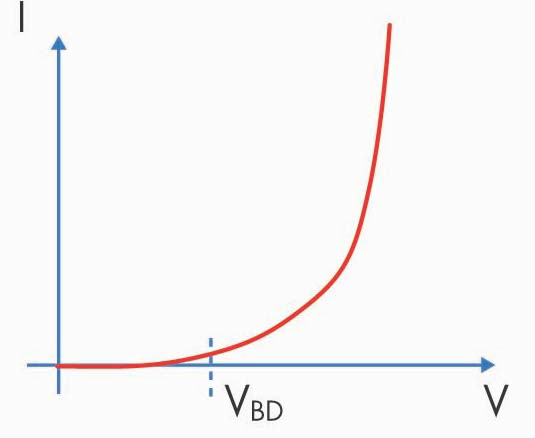
Figure 3: Typical Current-Voltage Curve of a Given EPG
This behavior creates additional losses at higher voltage levels. As voltage is increased, the resistance of EPG decreases. The loss current (I2) increases, which results in an increase of resistive losses. It is important to know that this surface current is not an indication of the health of the bulk insulation (Figure 4) and will be added to the total measured test current.
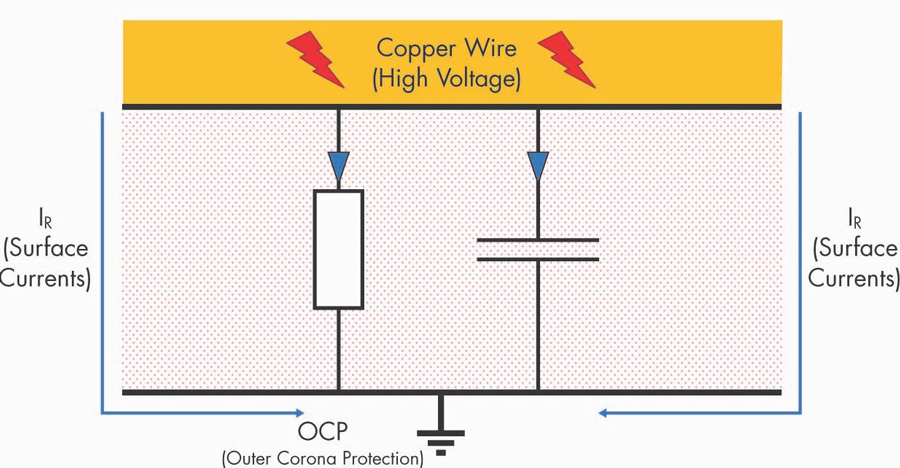
Figure 4: Schematic of Surface Current Circulating around Insulation
Various compounds are used for EPG, and each of them has its own conductive behavior. The chosen material will remarkably affect power factor values when voltage is increased above voltage breakdown (VBD), which is usually significantly lower than the rated line-to-ground (L-G) voltage of the machine.
Power Factor Tip-Up
Power factor tip-up is the difference between two PF values obtained from two measurements at two different voltages. Historically, when testing complete windings in North America, measurements are performed at 0.25 x UN/√ 3 and at UN/√ 3, where UN is the rated line-to-line voltage. The test is mainly used to detect voltage dependent anomalies in the winding such as those that create PD activity.
The theory of partial discharges is comprehensive and is beyond the scope of this article. However, a short description is helpful from this point forward. Even though normal PD activity is present in most medium- and high-voltage stator windings, PD can result from different anomalies. When these anomalies occur, the discharges will result in a small amount of dissipated energy. If there are several PD events, the amount of dissipated energy might be measurable during a PF measurement. PD activity only occurs above a specific inception voltage level that is dependent on the insulation system and the type of defect.
When performing a power factor tip-up test, the value obtained at 0.25 x UN/√ 3 is assumed to be exempt from PD activity, while the value at UN/√ 3 is assumed to contain the dissipated energy from the PD activity if present in the winding. In theory, a difference between these two measured values would indicate the presence of significant PD activity. However, with only two measuring points, it can be difficult to distinguish losses caused by a voltage-dependent defect from the expected increased losses caused by the conduction behavior of EPG. It is even more difficult to establish a tip-up limit because of the wide variety of EPG used by different manufacturers.
Guarding for Individual Bars/Coils
The power factor tip-up test is commonly used for quality control on newly manufactured coils and bars. Depending on the manufacturer and on customer requirements, it can be performed on each coil/bar or on samples of a production lot.
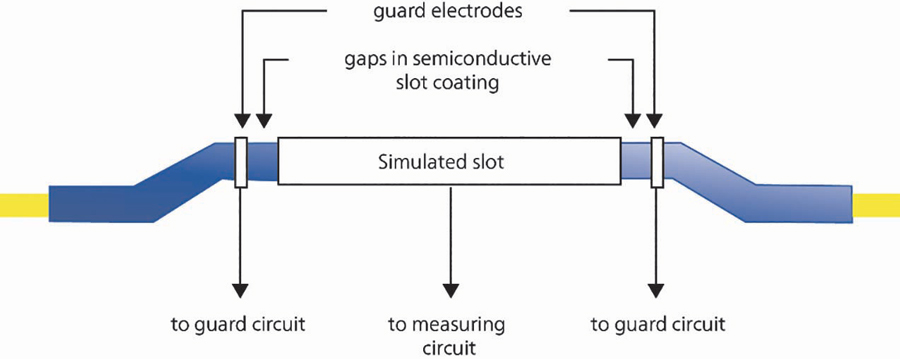
Figure 5: Stator Bar with Guard Electrodes
To remove the influence of EPG, various guarding techniques are used in the factory that cause the test to become more sensitive to the void content within the bulk insulation and less sensitive to the conduction behavior of EPG. Figure 5 shows a schematic of one guarding technique; Figure 6 illustrates the difference between measurements on a single coil with and without guard electrodes. Guard electrodes are not perfect, and a small contribution of surface currents is usually still measurable even with some guarding techniques.
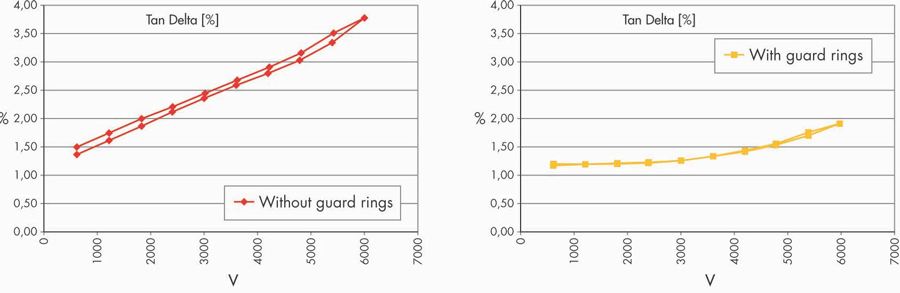
Figure 6: PF Voltage Sweep Curves: (left) without Guard Rings, (right) with Guard Rings
It is not feasible to install guard electrodes on every bar of completely assembled stator windings. Therefore, tip-up values obtained in the field — even for healthy machines — are usually higher than values recorded in the factory on individual coils/bars. Some EPG can be conductive even at lower voltage. For this reason, it is not recommended to compare values from individual coils/bars with the values obtained in the field on a complete assembled winding.
PD Hysteresis
Modern power factor test instruments are now able to record as many points as necessary and take measurements during the decreasing voltage stage of the test. Instead of simply measuring the tip-up value between two points, instruments can now record many data points, enabling visualization of the power factor voltage sweep curves. These curves can be used to extract additional information and enhance diagnostic capability.
PD usually occurs above a certain voltage level and results in small current impulses that create additional losses. Two parameters are commonly measured during offline PD measurements:
a) PD inception voltage (PDIV): the voltage at which PD appears when voltage is increased
b) PD extinction voltage (PDEV): the voltage at which PD disappears when voltage is decreased.
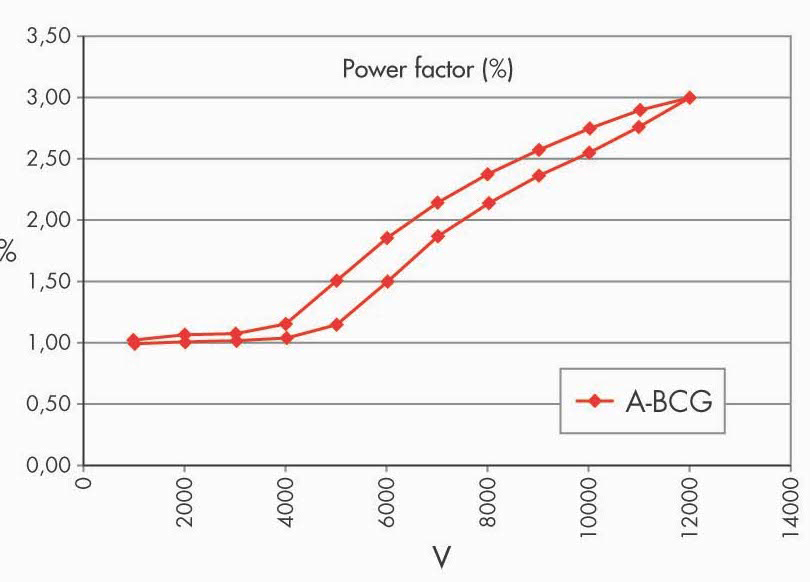
Figure 7: PF Voltage Sweep Curve with High Inner PD Activity
In many cases, PDIV is higher than PDEV. This means that, for a winding with high PD activity, losses can be higher when the voltage is decreased versus when voltage is increased. It is believed this behavior creates so-called PD hysteresis in PF curves when performing an upward and a downward voltage ramp. In various measurements, this correlation was confirmed between PD activity and a hysteresis of PF curves. It is important to mention that not all PD activity will exhibit this behavior. For example, corona-type PD is known to have similar PDIV and PDEV values and therefore will not exhibit the hysteresis curve. Figure 7 shows the results of a PF measurement of a winding with high inner PD activity; Figure 8 shows the PF results of a winding with low inner PD activity; Figure 9 shows an example of a winding with no significant inner PD activity.
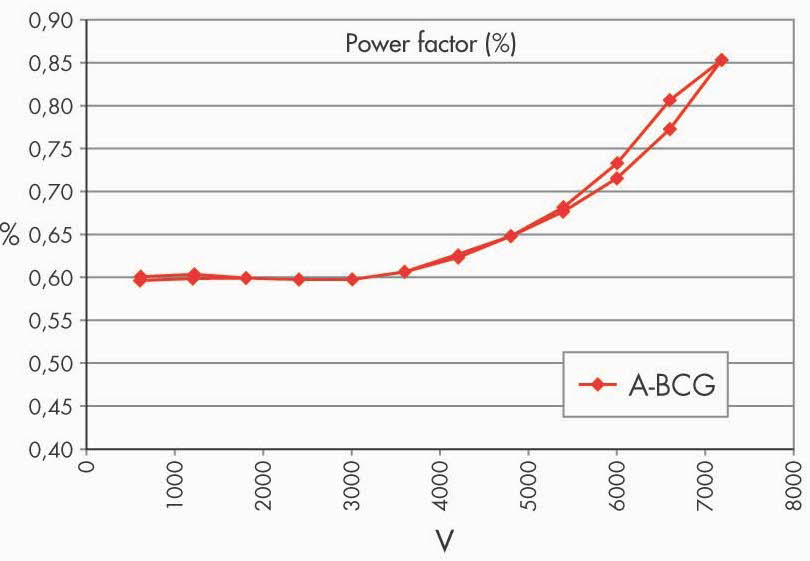
Figure 8: PF Voltage Sweep Curve with Some Inner PD Activity
Using power factor voltage sweep curves can help the test operator visualize whether the increase in power factor, with respect to the voltage, is due to partial discharges or simply the normal conduction behavior of EPG.
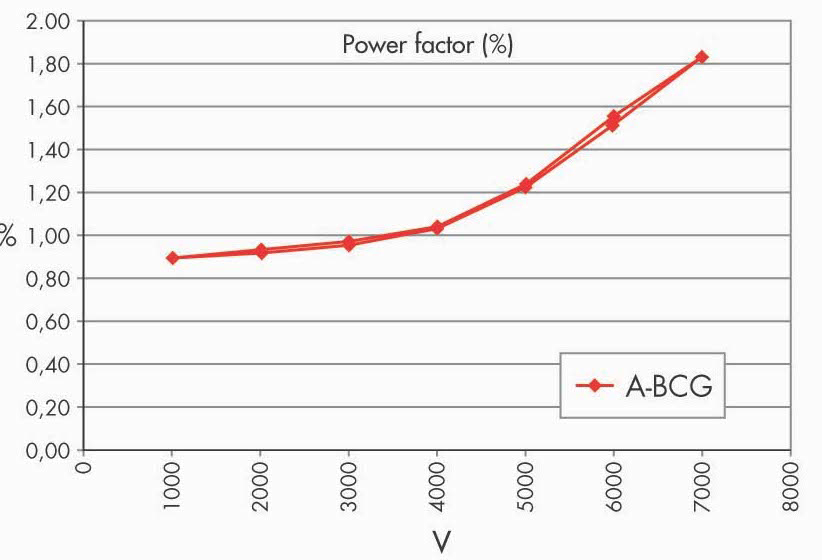
Figure 9: PF Voltage Sweep Curve with Low Inner PD Activity
Machine Construction
Machine construction can significantly influence the expected PF results for traditional tip-up values and for PF voltage sweep curves.
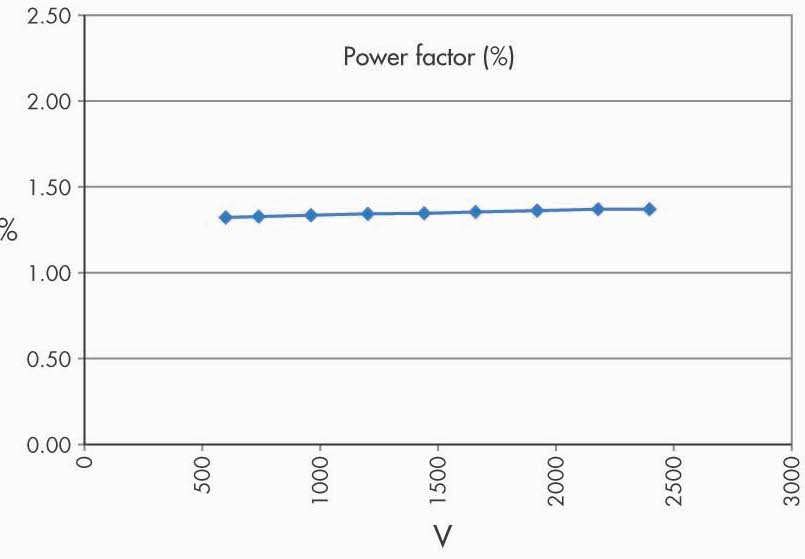
Figure 10: PF Voltage Sweep Curve of a Healthy 4 kV Machine
When performing PF measurements on a clean and healthy stator winding that does not have an EPG area, no significant increase of losses with respect to increased voltage is expected. A stator winding with rated voltage of 6 kV and below is an example of a machine that does not have an EPG area. However, some manufacturers have started to install EPG on machines operating at lower voltage, especially if they are inverter fed. Figure 10 shows the results of a healthy and clean 4.16 kV machine without EPG; Figure 11 shows a retired 4 kV machine with high PD activity and no EPG.
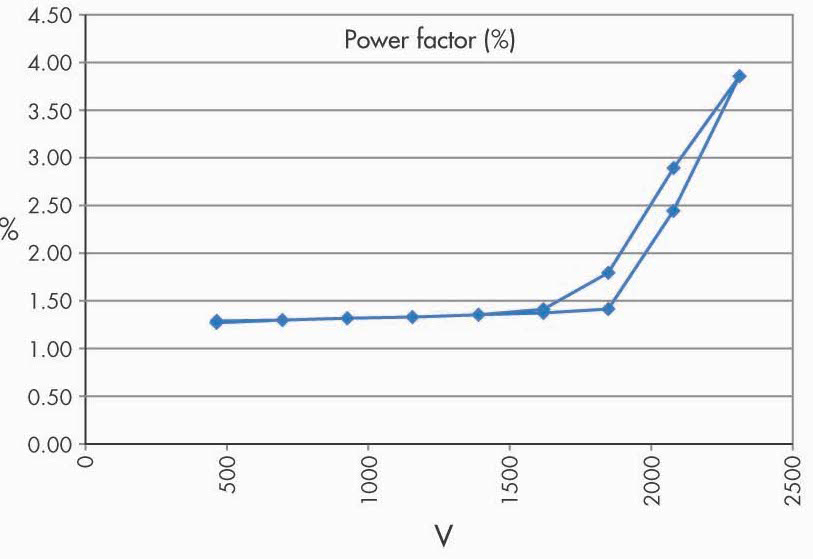
Figure 11: PF Voltage Sweep Curve of a Retired 4 kV Machine with High PD Activity
The number and length of slots can also significantly impact expected values. Machines that have many short slots will be subjected to higher influence from the surface current caused by EPG. This is because the surface current becomes dominant in comparison with the current that goes through bulk insulation (refer back to Figure 4). An example can be seen in Figure 12, where PF measurements of a healthy and clean winding show a large increase of PF values with respect to voltage. The PF values start at 1.50% at 1,000 V and increase to approximately 3.85% at 9,500 V. This is another factor to consider if tip-up limits are applied to a complete stator winding.
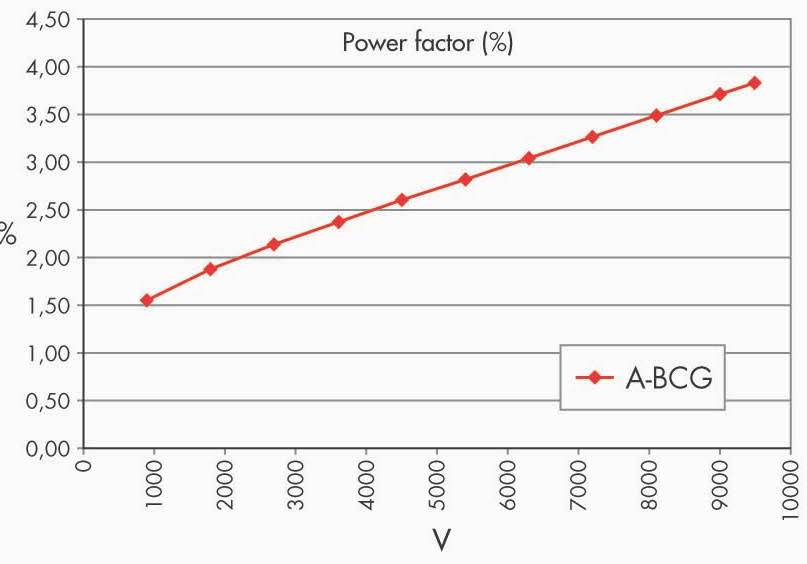
Figure 12: High Loss Contribution from EPG
Assessment
Neither IEEE 286 nor IEC 60034-27-3 currently publish limits for complete stator windings. IEC 60034-27-3 does include limits for individual coils and bars using guard electrodes. However, it is important to mention that many have questioned those values; they are viewed as too restrictive by some and overly lenient by others. In addition, these limits should not be applied for complete stator windings. The difficulty of establishing global limits results from numerous variables such as various insulating materials, different conductive behavior of installed EPG, and the geometry of the machine itself.
Power factor values, tip-up values, and voltage sweep curves should be recorded and trended over time. When measurements are recorded during similar environmental conditions at different points in time, increased power factor is generally a sign of insulation deterioration or aging. A comparison between phases and between similar machines can be useful, and empirical limits based on measurements performed on similar machines can also be established. In any case, it is recommended to consult with the machine manufacturer or the test equipment manufacturer when PF values display an upward trend over time.
If no historical data is available, the ability to perform an assessment from one single measurement is limited. PD hysteresis can therefore be used to verify the presence of PD within the insulation. In addition, a comparison between phases of the machine could also be used if the neutral point can be isolated.
Conclusion
Power factor measurement provides a general assessment of insulation with limited capability to detect localized weak points. Therefore, the values do not represent the most deteriorated part of the winding, as a large power factor value can be due to voids distributed all over the winding or a few single, heavily aged bars or coils. The impact of the latter case is potentially much more severe for the longevity of the winding. It is, however, good practice to perform measurements whenever possible and to trend the values throughout the asset’s lifetime. If an increase in power factor values or tip-up values is observed, further investigation including visual inspection and additional electrical tests can be triggered to complete the assessment.
Case Study
In January 2012, power factor measurements were performed on a 6.4 kV, 5.6 MVA hydro generator as part of a planned outage. The machine was manufactured in 1981. The neutral point was disconnected to test each individual phase separately, and the line terminals were isolated from the system as recommended by relevant standards.
The only available historical data from 1991 is illustrated in Table 1 and Figure 13.
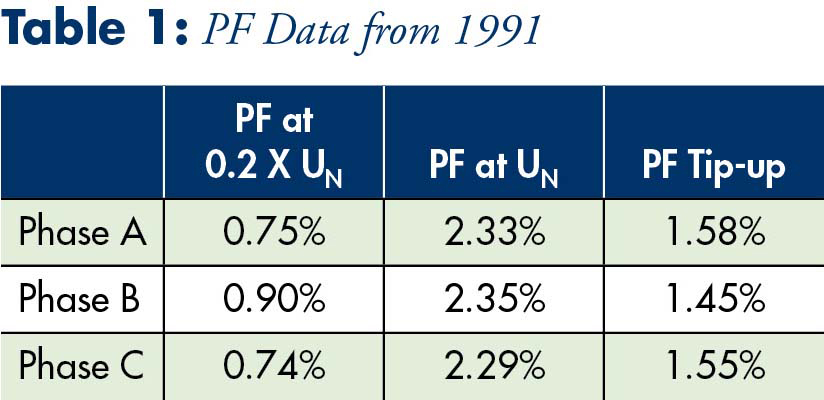
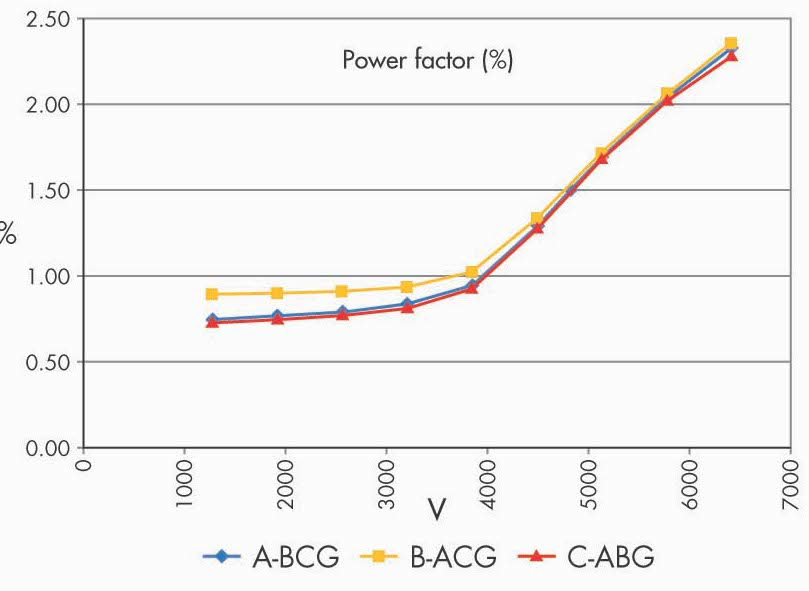
Figure 13: PF Voltage Sweep Curves from 1991
In this specific case, it was necessary to increase the test voltage up to UN. To display the PD hysteresis curves with enough resolution, a minimum of 10 data points is usually recommended. Therefore, the voltage was increased using increments of 0.1 x UN. The results are shown in Table 2 and Figure 14.
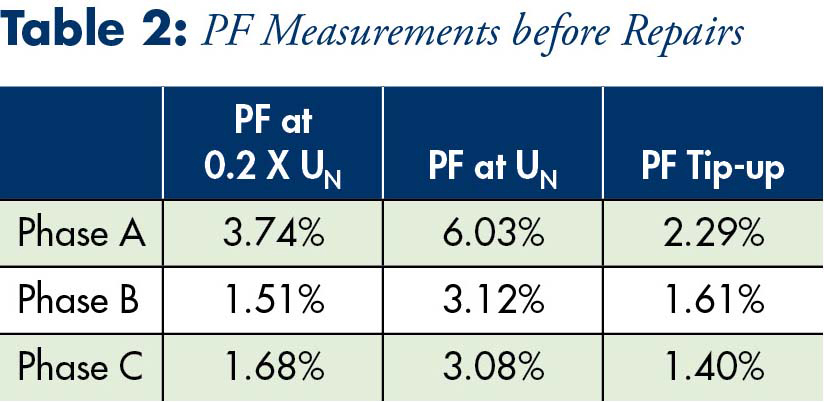
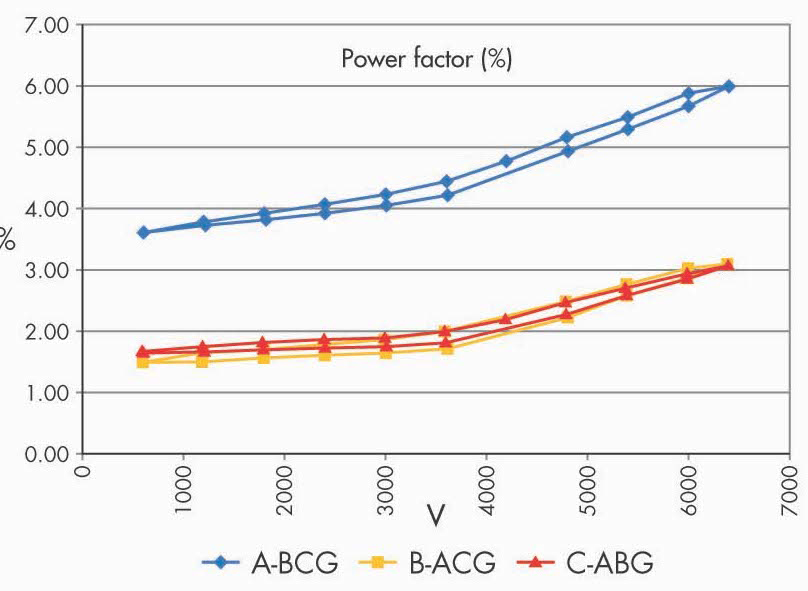
Figure 14: PF Voltage Sweep Curves before Repairs
Comparing the data from 2012 (Table 2 and Figure 14) to the data of 1991 (Table 1 and Figure 13) shows significant increase of all values for all three phases. Increased PF values could be expected due to aging since the measurements were taken 20 years apart. After all, at the time of the 2012 measurements, the machine had been operating for a little more than 30 years. However, the losses in phase A were more than twice the losses measured in the other two phases. In addition, hysteresis behavior was noticeable in all three phases, but predominantly on phase A. For these reasons, additional electrical tests were recommended to investigate the results.
The results of a dielectric frequency response (DFR) analysis confirmed the presence of an anomaly on phase A. To locate the defect in the winding, an AC dielectric withstand test at 1.5 x UN was initiated. A breakdown occurred in one coil located in the middle of the winding of phase A before reaching the final voltage level.
The failed coil was isolated from the winding, and the electrical tests were repeated. The results of the power factor measurements, after repairs, are shown in Table 3 and Figure 15.
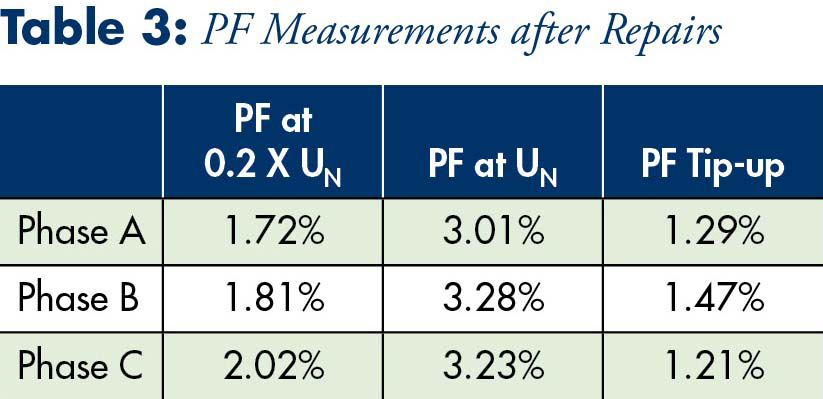
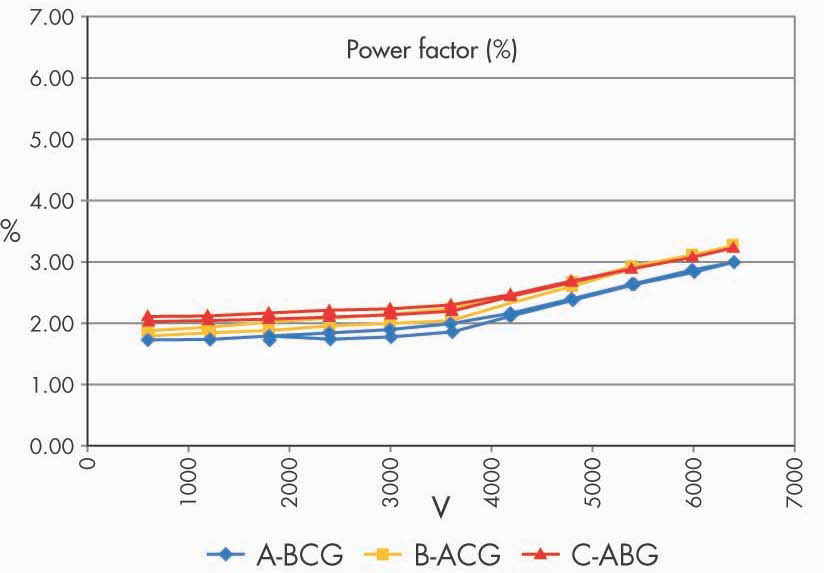
Figure 15: PF Voltage Sweep after Repairs
Following the repairs, the losses of phase A were similar to losses from phase B and phase C. Figure 15 also shows that hysteresis behavior has significantly diminished. Nevertheless, the values are still significantly higher (100%) than the data from 1991 and indicate insulation deterioration on all three phases.
References
IEEE Std. 286-2000, Recommended Practice for Measurement of Power Factor Tip-Up of Electric Machinery Stator Coil Insulation, pp 1-29, 2001, doi: 10.1109/IEEESTD.2001.92415.
IEC/TS 60034-27-3, Rotating Electrical Machines – Part 27: Dielectric Dissipation Factor Measurements on Stator Winding Insulation of Rotating Electrical Machines, 2015.
M. G. Krieg-Wezelenburg. “Dielectric Dissipation Factor Measurements on Stator Insulation — Results from a Global Survey,” 2020 IEEE Electrical Insulation Conference (EIC), Knoxville, TN, USA, 2020, pp. 269-273, doi: 10.1109/EIC47619.2020.9158740.
R. Omranipour and S. U. Haq. “How Critical are IEC 60034-27-3 Maximum Values for Dielectric Dissipation Factor and Tip-Up to Determine the Reliability of Motor Stator Insulation?” 2015 IEEE Electrical Insulation Conference (EIC), Seattle, WA, USA, 2015, pp. 364-368, doi: 10.1109/ICACACT.2014.7223474.
 Mathieu Lachance joined OMICRON electronics Canada Corp. in 2019 and presently holds the position of Regional Application Specialist for rotating machines and partial discharges. He previously worked as a test engineer in the fields of partial discharges and high voltage. Mathieu received a BS in electrical engineering from Université Laval in 2014.