
Medium-voltage (MV) power cables are the backbone of the power distribution systems developed over two hundred years. Currently, 2.3 million miles of MV cables are installed in the USA, most with extruded insulation. Diagnostic testing technologies can differentiate MV cables by their operational condition and aging process prior to faults, thereby providing guidance for proactive maintenance and asset management.
This article reviews popular MV cable diagnostic technologies, explains why the partial discharge (PD) test is an effective tool to diagnose MV cables, and summarizes typical PD test sensors used in onsite MV cable diagnosis. Interpreting data from onsite PD tests is also discussed because data interpretation is critical to achieving the expected advantages of PD tests.
Medium-voltage (MV) power cables are conventionally rated from 5 kV to 35 kV (phase-to-phase). Installation of MV power cables has soared since the 1960s. As shown in Figure 1, about 48,000 miles (250 million feet) of MV cable had been installed in the United States per year since 1965. Extrapolating the curve to 2020, more than 2.3 million miles (12 billion feet) of MV cable have been installed — more than 90 times longer than the Earth’s equator. Although some PILC, HMWPE, and XLPE cables remain underground, TR-XLPE and EPR cables dominate newly installed MV cables.

Figure 1: Cumulative Length of Medium-Voltage Cables Installed in United States Source: W. Shu, and N. Hampton
Despite continuous development of dielectric materials (including insulation, semiconducting shield, and jacket) and cable configurations, MV cable degrades and eventually fails due to the aging process. More than 56.8% of faults occur in cable accessories such as splices and terminations (Figure 2a); poor workmanship is the major failure mechanism in MV cable systems (Figure 2b).

Figure 2a: Component Failure Percentages/ Figure 2b: MV Cable Failure Mechanisms
Diagnostic testing technologies are therefore used to discriminate defects prior to premature failures in MV cable systems. Compared with other technologies, the partial discharge (PD) test is a more effective method to recognize types of defects and locate defective components.
Why Partial Discharge Test?
The most popular field diagnostic testing technologies for MV cable systems are DC and AC withstand tests, the dielectric loss test (Tan Delta), and the partial discharge test.
Withstand Test
The withstand test, also called high-potential (hipot) test, is the simplest testing technology for MV cable systems. The DC hipot test was first adopted in paper-insulated cables where testing voltage could be three to five times the rated voltage. Engineers quickly realized the DC hipot test could damage extruded cables due to high potential as well as space charge injection and accumulation.
The AC hipot test can be used in the field for extruded cables, although size requirements make it impractical for most circuits. This test normally applies two to three times the rated voltage to the cable system; the testing voltage needs to hold for one hour (1-hour withstand test). Since power cables are a capacitive load, the power required to energize the cable during the test is proportional to cable size and length, as well as the testing frequency.
The very-low-frequency (VLF) power supply has significantly reduced the size and power consumption compared with power frequency units. It is worth noting that VLF itself is not a testing technology. Instead, VLF is a type of power supply that typically provides a 0.1 Hz high-voltage sinusoidal waveform to energize the tested cable. VLF can be applied to all types of tests including the withstand test, dielectric loss test, and PD test.
The withstand test is a typical go-or-no-go test that requires minimum training to operate on-site. The test results are obvious, and no data interpretation is needed. However, the withstand test cannot recognize small defects that will not lead to an immediate fault but would significantly shorten the service life of an MV cable system.
Tan Delta Dielectric Loss Test
Tan Delta (TD) refers to measurement of dielectric loss, which is the ratio of resistive current and capacitive current in tested cables. In good electric insulation, resistive current is much smaller than capacitive current; thus, the dielectric loss is very small. In good XLPE insulation, the dielectric loss is in the range of 0.01–0.05%. Dielectric loss is higher in EPR — in the range of 0.2%.
Once the insulation system ages (i.e. contains water trees), TD values increase. The TD test evaluates the overall performance of the insulation system in the cable system. The advantage of the TD test is that it examines deterioration in the entire insulation, particularly if the insulation is in the process of water treeing. Disadvantages include that TD measurement cannot be performed in a hybrid circuit containing different insulation materials because the single measured TD value is a mixture of the entire circuit and cannot represent either individual segment. The TD test also cannot separate and recognize the type of defects — a large water tree and numerous small water trees may give the same TD values — and cannot localize the defect site.
Partial Discharge
Partial Discharge is defined as localized dielectric breakdown (discharge) of a small portion of a solid or fluid electric insulation system under high-voltage stress that does not bridge the space between the two electrodes. PD indicates defects or degradation in the cable system. When PD occurs, discharge activity erodes nearby insulation, which consequently accelerates insulation aging and deterioration. Interestingly, PD sources during the aging process may not be limited to the insulation. The metallic grounding sheath could break during thermal cycling (common for copper-tape sheath) or could be corroded (for neutral wires and copper tape). The broken neutral wires or copper tape may build up enough potential to ignite discharges, which erodes the semicon shield and the insulation and eventually leads to a fault. Figure 3 shows a cable fault caused by discharges between the broken/corroded copper-tape sheath.
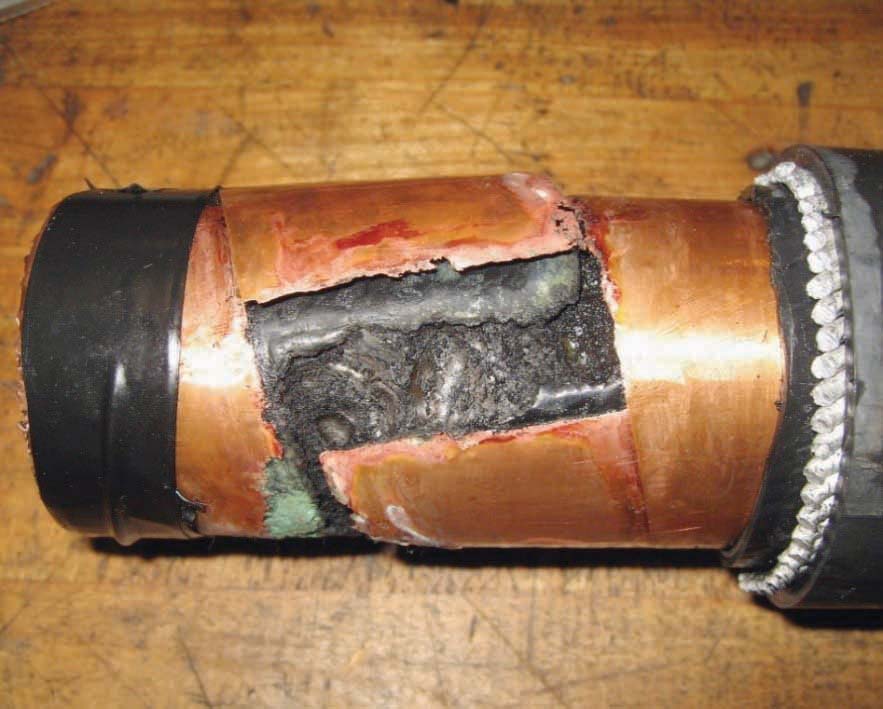
Figure 3: Cable Fault Caused by Discharges between Broken/Corroded Copper-Tape Sheath
Compared with other diagnostic testing technologies, the PD test has the unique advantages of distinguishing various types of defects and localizing the sources of those defects. One important feature for PD measurement is that different types of defects generate unique patterns with reference to the phase angle of the applied voltage, which is the so-called phase resolved PD (PRPD) pattern. Figure 4 shows discharge patterns for typical defects.


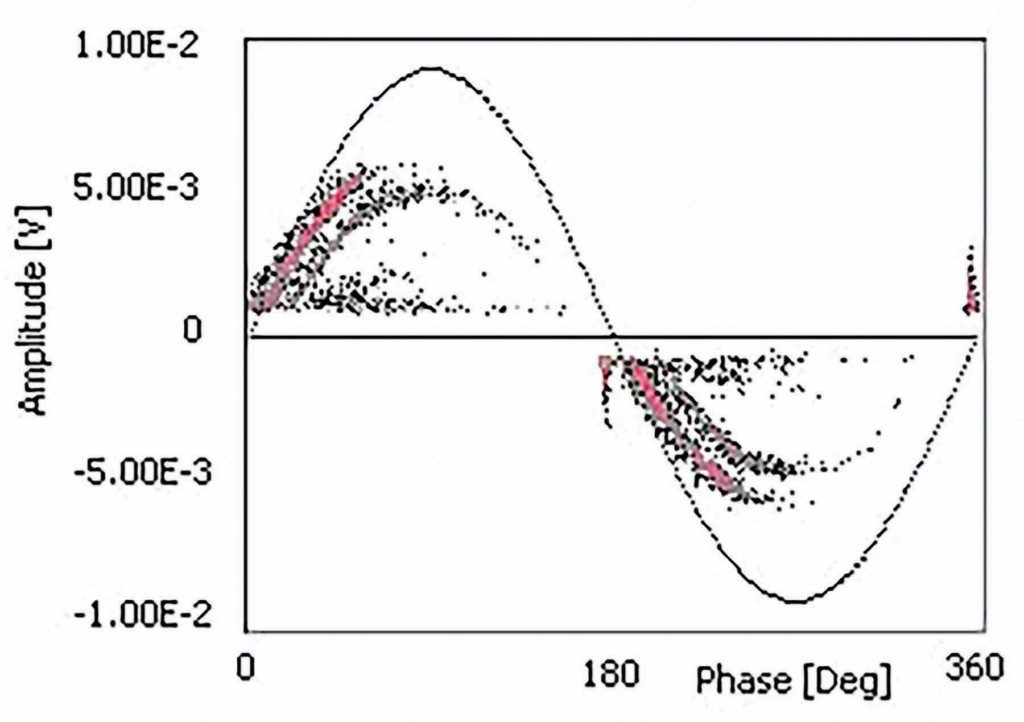
Figure 4: Discharge Patterns for Typical Defects: (top to bottom) Internal Discharges (void), Surface Discharges, and Corona Discharges.
A PD test can also locate the discharge site by using either time domain reflectometry analysis or frequency domain analysis. Indeed, PD signals are electro-magnetic pulses propagating in MV cables from the discharge site to the PD sensor. During PD signal propagation, pulse magnitude and bandwidth decrease with the propagation distance. Therefore, the discharge source location can be estimated by comparing measured PD magnitude at various locations or by calculating measured PD bandwidth. Alternatively, since PD pulses reflect at the splices and terminations, the discharge source location can be estimated by comparing the time difference of the first measured PD pulse and the reflected PD pulses (assuming total cable length and signal propagation velocity in the cable are known).
In the field, diagnostic technologies can be implemented individually or combined. For example, IEEE 400 recommends combining the simple withstand test with TD and/or PD tests. Called a monitored withstand test, this combination can tremendously improve diagnostic accuracy.
Sensors for Onsite PD Measurement
PD measurement is not difficult, and many PD testing instruments are commercially available. Selecting the proper PD instrument is critical and is determined by the purpose of the test, the equipment under test (EUT), and the skill of the operators. A PD instrument normally includes PD sensor(s), a data acquisition unit, and a data storage and processing unit.
Choosing the correct PD sensor is particularly important. Typical PD sensors for measuring MV cable systems in the field include capacitive coupler, high-frequency current transformer (HFCT), ultra-high frequency (UHF) antenna, transient earth voltage (TEV) antenna, radio frequency (RF) antenna, and ultrasonic (acoustic) antenna. All antenna-type sensors are mainly used to test cable accessories and connected components such as cable terminations, splices, and connected MV switchgear. These antenna sensors effectively screen large-magnitude PD activities such as tracking discharges and are typically very directional to pinpoint discharging sites. Many handheld PD testers are equipped with these antennas, which can be a great addition to conventional PD measurement of MV cables. However, most antenna sensors are not sensitive enough to recognize weak PD signals within cable insulation.
The capacitive coupler and HFCT are two of the most common sensors adopted for measuring PD in MV cable systems as well as other applications including HV/EHV cable systems, motors and generators, and transformers.
Capacitive Couplers
Capacitive couplers are installed in parallel with the EUT (Figure 5). Direct access to the cable conductor is required; thus, it is normally used in an offline test or permanently installed (online monitoring). A capacitive coupler achieves optimal PD detection sensitivity as it directly connects to the cable conductor. Moreover, capacitive couplers normally contain a voltage divider that can capture power frequency signals to synchronize with PD data acquisition as well as monitor the operating voltage of the tested circuits.
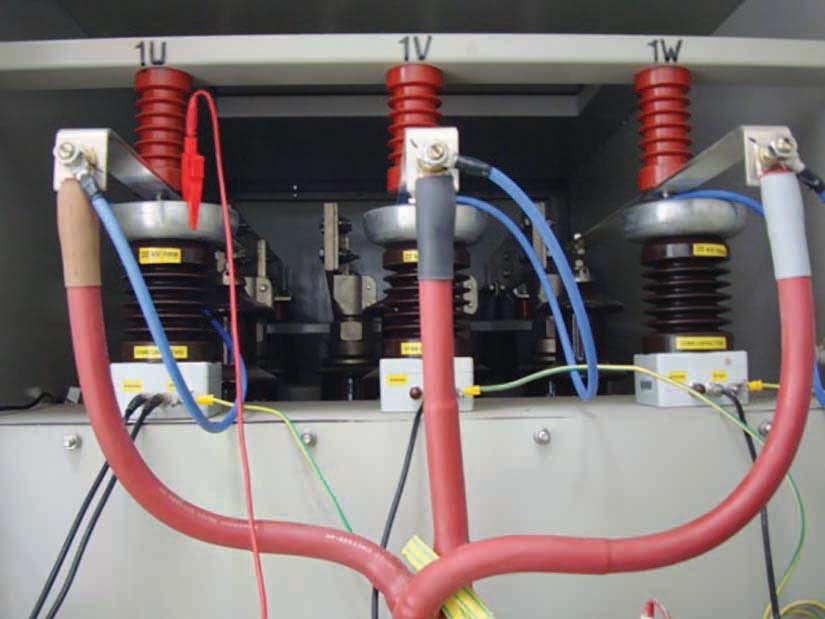
Figure 5: Capacitive Couplers on Each Phase of Cable Termination for a 15 kV Cable System
The disadvantage of using a capacitive coupler is that direct access to the cable conductors is required. Installing a capacitive coupler can be a challenge for certain cable configurations, such as if cable terminations are on a high riser pole. Since a capacitive coupler is a galvanic sensor, operational safety is another important consideration during on-site application.
High-Frequency Current Transformers
HFCT may be the most popular sensor for testing PD in MV cable systems due to its high sensitivity and simple installation. As shown in Figure 6, open-core HFCTs can easily be clamped over the ground wires of MV cables. HFCTs are directional as they capture PD-induced current through the ground wires. When HFCTs are installed at cable terminations as in Figure 6, PD sources from a cable termination and a cable section can be simply differentiated by checking the polarities of the acquired PD pulses. PD detection sensitivity of an HFCT is evaluated with the ratio of detected voltage to current going through the core; this ratio is normally presented in units of mV/mA or dBΩ. The sensitivity of a good HFCT can reach 25 dBΩ or 1mA of current going through the HFCT could generate 19 mV voltage to be measured by the data acquisition unit.
An HFCT does not provide a power frequency signal for synchronization. Other synchronization sources are required for PD data acquisition. A separate low-frequency current transformer (LFCT or Rogowski coil — the red coil in Figure 6) was adopted to capture the synchronization signal. The LFCT can be placed around the ground wire or over the entire cable under test.

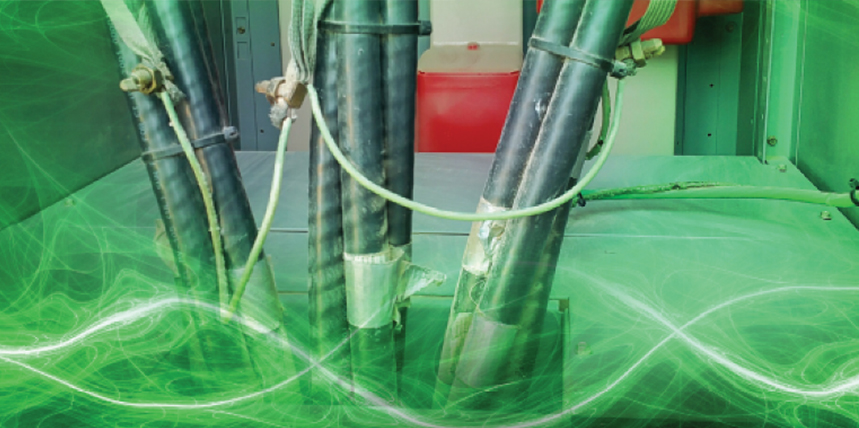
Figure 6: HFCTs Installed on Ground Wires of a Three-Phase 15 kV Cable System. The blue sensors are HFCTs; the red sensor is a Rogowski coil providing power frequency synchronization signal to the PD data acquisition.
When the LFCT is placed over the ground wire, the measured power frequency current is the capacitive current going from the cable conductor through the insulation to the ground wire. This current has 90° phase shift to the conductor voltage, which needs to be compensated for during data analysis. If the LFCT is placed over the entire cable, the situation is more complicated as the measured current could be the load current (online test, cable with load) or capacitive current (offline test, cable without load). If the LFCT measures load current, the small phase shift from the voltage (power factor) must be compensated for during further analysis.
Measuring PD in a MV cable system is not difficult once a proper PD instrument/sensor is selected. Most PD instruments have simple procedures and user-friendly interfaces that a technician can master with self-learning or minimal training. Some handheld PD instruments feature various indicators (LED lights or audible sounds) to identify the existence of PD activities and illustrate the amplitude of PD events. If the purpose of the test is limited to these tasks, the PD test process could be stopped. However, the most significant advantages of a PD test — recognizing the type of defects and locating the defect sources — cannot be achieved without further data interpretation.
Data Interpretation for MV Cable PD Test
The first questions when looking at measured PD results from various instruments are “How can I ensure the measured or displayed signal is the PD in the MV cable system? What does the displayed value mean, and what should we do with those results?” These are two of the questions that must be solved during PD data interpretation, which is the most important but also most challenging step of MV cable PD tests.
PD data interpretation can be generalized in three steps: signal separation, signal identification, and diagnosis (S–I–D).
Signal Separation
Signal separation is fundamental for PD measurement. The most significant challenge for all PD measurement is to discriminate relevant PD signals from various noises and interferences. This is particularly difficult for online testing because cable systems are exposed to complicated field conditions with numerous types of interference. All PD testing instruments have implemented at least one noise separation technique. For example, frequency filtering is a conventional method to remove interferences if the PD signals have different frequency spectra from the noise. Almost all PD testing devices are equipped with varying filters to improve PD detection sensitivity, but they have limitations for noises that share a similar frequency spectrum with the PD signals. T-F Map analysis has proven to effectively separate signals from various sources. It categorizes observed signals by the equivalent pulse (T) and equivalent pulse bandwidth (F). Signals from the same source tend to have the same T and F, which form clusters in the T-F Map, as shown in Figure 7. T-F Map analysis performs well to discriminate PD signals from varying types of interference, as well as to separate PD signals from different sources.

Figure 7: Signal Separation and Identification with T-F Map Analysis and Phase Resolved Partial Discharge (PRPD) Pattern. Data was measured from a VLF PD test for a 35 kV cable system: (a) the entire PRPD pattern of the acquired data

Figure 7: (b) T-F Map clustering for the acquired data

Figure 7: (c) PRPD pattern for the black cluster in the T-F Map

(d) PRPD pattern for the red cluster in the T-F Map
Signal Identification
Signal identification recognizes the types of discharge sources using the phase resolved partial discharge (PRPD) pattern. The PRPD pattern is essentially the cumulative distribution of the PD occurrence in reference to one power cycle. The shape of the distribution is determined by the types of defects, as was shown in Figure 4. Identifying the types of defects is critical for any further assessment, as the severity of the discharge varies with the type of defect. For example, corona discharge may have great magnitude, but does not cause insulation degradation in the short term, while internal discharge may lead to initiation and growth of an electrical tree, causing the insulation system to break down in a short time even if the discharge magnitude is low.
Signal separation and identification are intricately connected. Figure 7 shows an example of signal separation and identification for a set of PD data measured in the field. The PD test was performed on a 35 kV cable system with HFCT placed at the cable termination. The cable was energized with a 0.1 Hz VLF power supply, and the testing voltage for the results shown was 20 kV (operating voltage).
Figure 7-a is the entire measured data presented in the PRPD pattern. Figure 7-b shows the same PD data mapped by its equivalent pulse width and pulse bandwidth (T-F Map). Each dot in the PRPD pattern is one measured pulse, which has a corresponding dot in the T-F Map. The possible PD signals are all overwhelmed by the strong interferences in the overall PRPD pattern. However, the T-F Map clusters the signals from similar sources. By examining each cluster in the T-F Map, it was determined that all black dots in the T-F Map are noises (Figure 7-c), and the red dots are internal PD from the tested cable termination (Figure 7-d). Since the internal PD signal was detected only at the operating voltage, this cable was not recommended to be energized until the discharging defect has been mitigated.
Besides recognizing types of defects, the identification stage also includes locating the discharging elements in the MV cable system. The value of the PD test results would be limited if the PD sources could not be located with reasonable accuracy. The PD sources in MV cable systems are normally located using the following techniques:
- Time-of-arrival analysis. The principle of using time-of-arrival analysis to locate the PD site is the same as the time domain reflectometry (TDR) test. Once PD occurs in the MV cable system, the PD pulse propagates along the cable in both directions. The discharge source location can be calculated by the time difference between the original pulse and the reflected pulse captured with one PD sensor, with prior knowledge about the PD pulse propagating velocity in the tested cable, the cable length, and/or the position of the splices.
- Frequency spectrum analysis. This method utilizes the knowledge that PD signal bandwidth attenuates with the propagation distance in the MV cables. This method is not as accurate as time-of-arrival analysis, but it has the advantage that no reflected PD pulse is required (which could be difficult to see for long cables).
Diagnosis
PD test results can be presented using two approaches:
- Traditional indicators: numerical parameters from PD measurement such as PD magnitude, PD inception voltage (PDIV) and extinction voltage (PDEV), repetition rate, etc.
- Diagnostic indicators: normally a level-scaled system to indicate condition levels, severity of defects, and the corresponding actions
Traditional indicators can be directly observed from the PD testing instrument, which has the benefit of simplicity. However, those numerical values are not actional and still require interpretation for maintenance planning. Diagnostic indicators are the preferred PD test results for asset management.
Table 1 shows an example of a five-level diagnostic criteria that categorizes the cable system by the probability of failure in a certain time frame. The indicators provide clear reference to the circuit owners for maintenance planning.

Table 1: Five-Level Diagnostic Indicators for PD Test of MV Cable Systems
The challenge in deriving the diagnostic indicator is that PD diagnosis does not rely on a single parameter (PD magnitude) for the condition assessment because:
- The severity of discharge activities is determined by the types of defects.
- The tolerance against PD activities varies between devices.
The analysis process includes all the collected information regarding the types of defects, the characteristics of the equipment under test, installation and operating conditions, and the quantified PD parameters. Unfortunately, there is no universal recipe that can be adopted. The diagnosis still depends on the knowledge and experience of the analyst.
General guidelines for diagnosing MV cable systems:
- PD magnitude is not the only parameter to evaluate the severity of PD activities. The PD repetition rate (number of PD pulses per unit time), type of defects, PD site location, insulation materials, cable configuration, etc., are all required to rigorously evaluate the severity of PD activities.
- PD defect severity increases from corona discharges up to surface discharges up to internal discharges.
- Extruded insulation materials (PE, XLPE, EPR) have much lower PD tolerance compared with oil-paper insulation (PILC).
- Cable accessories normally can survive longer with PD than cables with extruded insulation.
- Trending analysis — comparing the growth of PD magnitude and repetition rate over time — yields more accurate information for the level of degradation and provides a better estimate of probability of failure within a certain time frame.
Conclusion
Although the benefits of diagnostic testing in MV cable systems have been widely accepted in both installation (commissioning test) and operating (maintenance test), the main competition for all testing technologies is the run-to-failure practice. Over 40% of the MV cables operated in North America are not subjected to any diagnostic tests. Fortunately, the tide is turning as more and more cable owners accept diagnostic testing technologies as asset management tools to improve MV cable system reliability and to save lifetime asset management cost.
It is well-accepted that the PD test has the unique advantages of distinguishing various types of defects and localizing the sites of those defects. However, adopting the PD test to diagnose a MV cable system is controversial. Performing the PD test is quite simple, as a wide range of commercial PD instruments and sensors are available. However, performing the diagnosis with the measured PD data is a challenge that requires a wealth of training. Hopefully, in the near future, PD data interpretation can be simplified through rapid development of computer engineering and artificial intelligence.
References
H. Orton. “History of Underground Power Cables,” IEEE Electrical Insulation Magazine, Vol. 29 (4), July/August2013, pp. 52-57.
W. Shu, and N. Hampton. “Evolution of MV Cable Designs in the US from 199 to 2014,” IEEE International Conference on Communications, Sub A, October2018.
N. Hampton, “Historical Overview of Medium and High Voltage Cables,” Online at https://www.neetrac.gatech.edu/publications/Cable_History_Doble_Final_Website.pdf.
J. Guo and W. Shu. “Online Partial Discharge Diagnosis for Power Distribution and Transmission Systems,” NETA World, Fall 2018.
 Dr. Jim (Jun) Guo joined TechImp US Corp as VP of Technology in 2015. His research interests focus on high-voltage dielectric aging and breakdown theories, partial discharge measurement and analysis, and high-voltage equipment diagnostic testing and monitoring. He received his PhD in material science at the Electrical Insulation Research Center, Institute of Material Science, University of Connecticut, Storrs in 2010. Jim previously was the Engineering Systems Analyst and Project Manager with CableWISE, where he focused on online diagnosis for power transmission and distribution systems. He has more than 30 publications in peer-reviewed journals and international conferences and holds four US and international patents. He is a senior member of IEEE and the IEEE Insulated Conductor Committee, and currently serves as Chair of the Membership/Chapter Committee in the IEEE Dielectric and Electrical Insulation Society. He is also an associate editor for IET Science Measurement & Technology.
 Zhong Zheng, an IEEE senior member since 2011, received his PhD from the University of Toronto, Canada, in 2006 and joined TechImp the same year. He became a professor in North China Electric Power University in 2008. With a research interest in partial discharge and insulation material, he has published more than 100 technical papers and been awarded more than 20 patents.