
In commercial and industrial power systems, harmonic currents can create a variety of issues, including increased power losses and potential damage to equipment. This article describes the various types of power losses associated with neutral and ground harmonic currents with a focus on resistive losses, transformer losses, and dielectric losses in distribution and power factor correction capacitors, and how these losses can be corrected. Several case studies on overall plant energy consumption are presented with most energy and emission improvements well over 5%.
UNDERSTANDING LOSSES
As industrial and commercial power systems become more complex, the presence of non-linear loads increasingly introduces harmonic currents into neutral and ground systems. These harmonic currents result in increased power losses and greenhouse gas emissions and can have deleterious effects on system operation and equipment longevity. A comprehensive understanding of these power losses is essential for optimizing system design, operation, and mitigation.
Resistive (I2R) Losses
The most commonly understood power loss in electrical systems results from conductor resistance, known as I2R loss. The power loss is given by P = I2R where P is in watts, I is the harmonic current, and R is the conductor’s resistance. Harmonic currents, just as line frequency currents, can significantly increase these losses due to their squared influence on power loss.
Transformer and Core Losses
Less understood — but having a much higher impact on power consumption — harmonics introduce additional power losses in the cores of transformers. Neutral and ground harmonics, which are even less generally understood in power transformers, have a similar impact and are much more difficult to detect through standard power and harmonic measurements.[1] The losses include hysteresis, eddy current losses, and core resonance. Hysteresis losses (Ph) due to continual magnetization and demagnetization of the core can be approximated as shown in Equation 1.
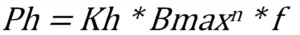
where Kh is the hysteresis loss coefficient, Bmax is the maximum flux density, f is the magnetic field frequency, and n is the Steinmetz exponent, which is typically between 1.5 and 2.5 depending on the core material.
Eddy current losses (Pe) result from induced currents within the core itself and can be estimated as shown in Equation 2. Both types of losses increase with the presence of harmonics due to increased core flux saturation and higher harmonic frequencies.

where Ke is the eddy current loss coefficient and t is the thickness of the transformer core laminations.
The neutral and ground currents at the transformer depend upon phase balance and harmonic currents. In most instances, including in standards, the focus is on triplen harmonics as it is thought that other harmonics negate each other. As will be shown in the case studies, this is not the observed case in which 5th, 7th, and even harmonics are often found in neutral and ground systems.
Assuming even a balanced circuit with harmonic content, the three phases of harmonics are added in the neutral. While normally adding to zero, with the addition of harmonics, the complex values (magnitude and phase angle) are added in the neutral as In = Ia + Ib + Ic.
Depending on the application, if no neutral is present, these may instead add to the ground. The amount of harmonic neutral or ground current present will require either the derating of the transformer or a K-rated transformer in addition to the impact of power harmonic content.
Skin Effect Losses
High-frequency harmonic currents can cause a phenomenon known as the skin effect, increasing the effective resistance of conductors. This effect is particularly significant for harmonic currents, which have higher frequencies than the fundamental frequency. An in-depth analysis of this effect necessitates consideration of the depth of current penetration into the conductor, which is dependent on the frequency of the material properties and the conductor. Equation 3 represents the approximate skin depth, which would also be affected by the magnetic fields (EMI) surrounding the other nearby conductors.
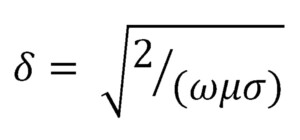
where δ is the skin depth, δ is the angular frequency, µ is the permeability of the conductor, and δ is the electrical conductivity of the conductor.
The higher the associated frequency, the less conductor is available to current flow. The result is an additional I2R loss that would have to be determined at each frequency and current value.
Power Factor Correction Capacitors
Power factor correction capacitors (PFC) can introduce dielectric losses due to the charging and discharging of parasitic capacitance under AC voltage. The power loss, P, can be calculated as in Equation 4, in watts. Harmonic currents can exacerbate these losses due to their higher frequencies, leading to increased charging and discharging cycles.
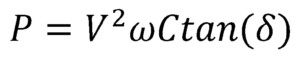
where V is the rms voltage across the capacitor, ω is the angular frequency, C is the capacitance, and tan(δ) is the loss tangent of the dielectric material.
Power factor correction capacitors are impacted by neutral and ground harmonics in the following ways:
- Overheating and premature failure. When harmonic currents flow through the PFC, they cause an increase in reactive power drawn by the capacitor. This leads to overheating, which can result in premature failure of the capacitor by degrading the dielectric material.
- Resonance. The presence of harmonics can lead to a phenomenon known as resonance in the electrical network, especially when the network inductance and PFC capacitance form a resonant circuit at a specific harmonic frequency. This can cause high oscillatory currents or voltages, causing increased stress on the capacitors and other electrical components. This resonance can result in excessive voltage distortion and capacitor failure.
- Detuning and inefficiency. Harmonic currents can cause the PFC capacitors to detune. PFC capacitors are designed to operate at the fundamental frequency (usually 50 or 60 Hz), and the presence of harmonics can shift the effective operating frequency, making the PFC system less effective.
Combined with capacitive losses associated with cables and conductors, PFC and power system capacitance will result in additional ground and neutral loads.
Resonance-Related Issues
While not technically a power loss, resonance caused by harmonic frequencies can lead to overvoltages, increased harmonic distortion, and potential equipment damage. The addition of PFCs and long cable and conductor runs can exacerbate these conditions due to the potential creation of resonant conditions with the system’s inductance. In some cases, resonance can cause high oscillatory currents, leading to additional I2R losses.
System Reliability Impacts
The losses associated with neutral and ground current can also have a number of impacts on system reliability. These impacts include:
- Increased risk of outages. Overheating of the neutral and ground conductors can increase the risk of outages.
- Reduced power quality. The harmonics can reduce power quality, which can lead to equipment malfunctions and safety hazards.
- Increased maintenance costs. The losses associated with neutral and ground current can increase maintenance costs.
CASE STUDY: 3MW FOOD PROCESSOR
Continuous monitoring was performed at the utility meter (Figure 1) with an EMPATH ECMS-1 electrical signature analyzer (ESA) to view the impact on neutral and ground currents by installing shunt inductive filters. Overall power harmonics were found to be an average of 12% THD current and 1.5% THD voltage on the primary 12,470-volt side of the substation transformers.

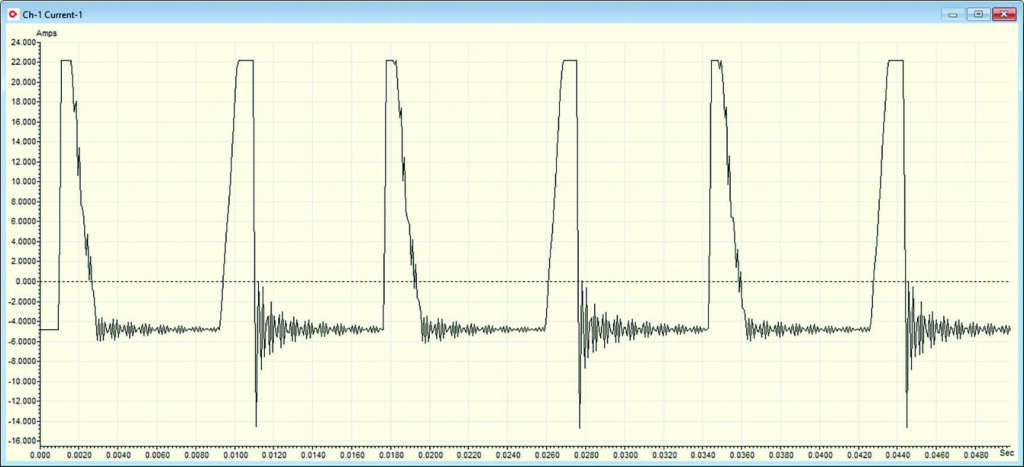
Data was monitored for more than 30 days prior to installing the filters, and sample data was collected on sample neutrals and grounds (Figure 2). Energy analysis was performed using data from the utility meter provided by the utility.
The application of Onics Energy’s neutral harmonic filters (Figure 3) was performed first with a 6.5% drop in utility meter kWh and demand immediately after installation at the same production level (Figure 4).

Figure 4 represents the impact following the installation of harmonic filtering on lighting panel neutrals and power panel grounds.
Figures 4 and 5 represent the raw data measured every 15 minutes from the utility meter in both kilowatt-hour usage and kilowatt demand on the switchgear feeding the substations.

Figure 5 was found immediately after installing filtering on the grounds of 8 large compressor soft starts. Production levels were the same, or higher, as electrical capacity increased, and nuisance trips, small drive failures, and other production reliability impacts were eliminated with neutral and ground noise improvements.
This was followed several months later by the application of ground harmonic filters on large soft starts with an additional drop of approximately 7.5% for a total of just over 14% reduction in demand and kWh. During the pre-installation monitoring process, the ESA device was able to identify a loose connection on a subtransformer immediately following installation and a defect in utility power. This was found to be a failing 69 kV distribution cable, that was caught soon enough to prevent an outage, although several systems in-plant were damaged.
As with most energy projects of this type, heating and cooling days must be identified; incoming raw materials must be recorded; in-process applications, energy density, and waste product must be identified; and the final output product must be identified. In effect, a process or industrial engineer is used as part of the energy consumption study in order to match similar days and energy use in order to identify energy improvements by production (i.e., kWh per widget).
This ties the energy project directly to production levels, ambient temperatures, and production energy density. These can then be tied to other indicators such as greenhouse gas emission impact. In this case, the average reduction was 3,416.4 MWh per year with an average in the area of 0.709 metric tonnes of CO2/MWh. This resulted in a reportable reduction of 2,422 metric tonnes of CO2 per year just by filtering out ground and neutral harmonic content.
CASE STUDY: ELECTRONIC BOARD JOB SHOP
In some instances, identifying the impact of energy savings can be more challenging, such as in job shop manufacturing. In these instances, the cost per unit of production becomes even more important, especially when production increases are dramatic. The use of machine learning and AI or the use of advanced energy analysis software tools are often required in these instances.
Evaluation
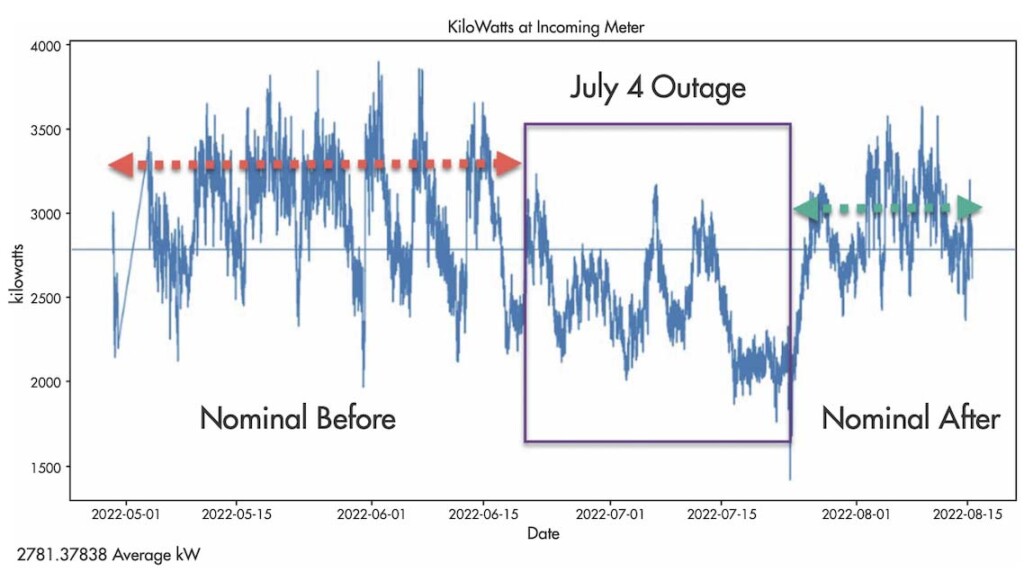
Following the installation of the neutral and ground filtering system, the utility kWh data was evaluated with the possibility of an increase in energy consumption as shown in Figure 6. The application of data science visualization allowed the evaluation team to identify several conditions that changed the evaluation. First, a review of the product manufactured and the energy intensity of each product showed that production had dramatically increased over the prior year. Next, using the production and energy data, it was determined that temperature had a very limited effect on energy consumption, providing a tolerance of less than +/-1% of overall kWh.
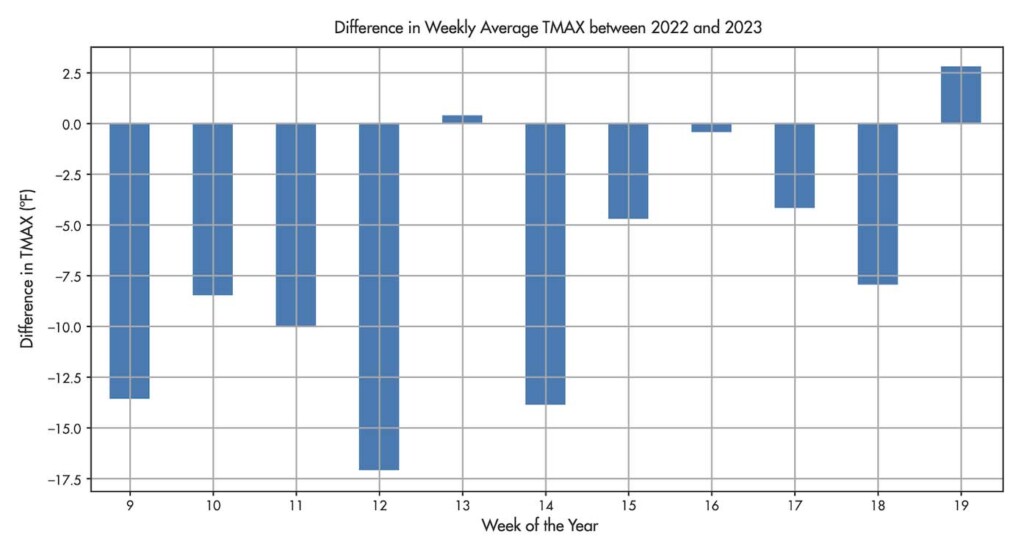
The differences were still included in the evaluation (Figure 7) to provide conservative energy savings.
One of the challenges was that the data from the utility was provided in quarter-hour increments while the production data was entered as weekly values. Data analysis further identified that the energy consumption and reported production numbers lagged, meaning that usage increased with low production values followed by lower consumption with randomly higher production values.
A discussion with the site owner found that while production data was kept by station, the reported numbers were finalized once they went into storage. This resulted in the investigators developing a machine-learning process for evaluating and smoothing production data from over two years, including breaking kWh per unit of production by incremental volume and energy intensity. The trained data was then applied to new production and energy information outside of the training data and was found to be within 0.2%.
Data from the installed ECMS-E1 system was utilized to identify unusual conditions and events that would impact the analysis. ESA was not used outside of utility data verification, system defect and degradation monitoring, and granular data for energy savings. It is common for energy organizations to measure specific in-house applications to monitor before and after consumption. This study has found that it is critically important to collect this data at the utility meter as well, due to parasitic losses in the system. Local monitoring should only be used for verification and indicators.
The evaluation was then reinserted to a 30% testing set (a 70/30 train-test-split not included in the training data) prior to the energy modification with the result being less than a kWh per week difference between projected and actual. Base energy consumption was also determined, which further concluded that production energy efficiency increased with increased production.
Results
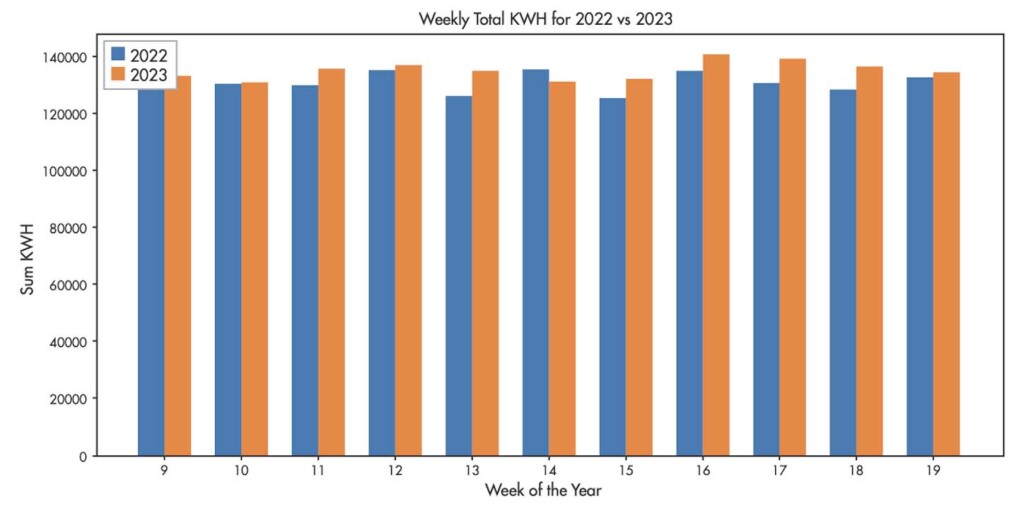
The simple comparison, excluding production volume and per unit of production energy evaluation, was about a 2% decrease in prior to present year consumption (kWh). The identification of the increase in volume over the prior year showed a dramatic difference: The final energy improvement was found to be 26.8% average at each increment of 5,000 units of production above a minimum number. This was then applied to a forecast based on the expected increase in production and then compared to new data produced during the evaluation. While demand changes were not discussed in this article, demand also showed significant improvement.
The data was presented to the local utility for a potential rebate award. The initial evaluation of simple reduction (present over the prior year kWh) qualified for a small rebate. However, the utility used a third-party data science company to verify the data, the conclusion from the utility was to award the maximum rebate available. The utility calculated and confirmed a reduction of 342 MWh over the next year and a California ratio of 0.276 metric tonnes of CO2 per MWh. This results in 94.4 tonnes of CO2 per year reduced while improving cost per unit of production.
CONCLUSION
In the 1990s, it was thought that the total losses to ground, neutral, and power harmonics would be somewhere in the 2% range, which equaled the known 2% improvement from loose connections, power factor, undersized conductors and transformers, and other electrical conditions. Instead, the number has been increasing dramatically. Numerous other projects — this article includes just two case studies — have found that this number increases exponentially as energy-efficient systems and electronic systems are introduced into a facility. Extremely energy-intensive organizations such as data centers have also achieved large improvements.
Power factor correction was one traditional power system improvement that was found to have a negative effect on modern power systems. The higher the power and neutral/ground harmonic content, the higher the loss values have been found. This also means that when power factor correction is required in a facility, it should be performed in tandem with power, ground, and neutral harmonic correction. The result is also the reduction of resonance issues and damage to power factor correction systems.
While this article has focused on an area that has received limited attention, it does identify that power, ground, and neutral harmonic losses have a sizeable impact on energy consumption. The loads related to these losses produce no useful work and often have a direct impact on the reliability of electrical and electronic equipment. In each case, even simple maintenance tasks such as bulb replacement are reduced.
Other observations have found that when energy-efficient improvements, including variable frequency drives, are installed in constant load applications, the actual energy consumption does not decrease — and sometimes increases — until the harmonic conditions are improved.
From an energy calculation standpoint, when looking at steady-state commercial and industrial applications, energy reduction can be observed directly. In job shops, variable load production, variable energy intensity systems, and others, the use of energy use per unit of production normalized to variables such as temperature, heating and cooling days, and even base loads and production increments, becomes important.
The use of modern tools related to data science is useful for these types of analysis so long as energy, production, and waste data are provided. Using a monitoring device from the sub or utility meter provides granular data that can be used to determine the cause of variations. In this case, the data was also monitored by a cloud application that used AI to trigger alerts to overall anomalies as an added reliability benefit to the energy project.
REFERENCES
[1] IEEE Std. C57.110–2018, IEEE Recommended Practice for Establishing Liquid Immersed and Dry-Type Power and Distribution Transformer Capability when Supplying Nonsinusoidal Load Currents. [2] IEEE Std. 1459–2000, IEEE Standard Definitions for the Measurement of Electric Power Quantities Under Sinusoidal, Nonsinusoidal, Balanced, or Unbalanced Conditions. [3] IEEE Std. 519–2022, IEEE Standard for Harmonic Control in Power Systems. [4] H. Aintablian. “The Harmonic Currents of Commercial Office Buildings Due to Nonlinear Electronic Equipment,” Southcon/96 Conference Record, Orlando, FL, USA, 1996, pp. 610–615, doi: 10.1109/SOUTHC.1996.535133. [5] W. H. Kersting. “The Computation of Neutral and Dirt Currents and Power Losses,” IEEE PES Power Systems Conference and Exposition, 2004, New York, NY, USA, 2004, pp. 213–218 vol.1, doi: 10.1109/PSCE.2004.1397573. [6] M. E. Mahadan, A. F. Abidin, M. A. T. M. Yusoh, and M. A. Hairuddin. “Modeling Neutral to Ground Voltage (NTGV) on the Educational Building,” 2022 IEEE International Conference in Power Engineering Application (ICPEA), Shah Alam, Malaysia, 2022, pp. 1–6, doi: 10.1109/ICPEA53519.2022.9744653. [7] R. M. Ciric, A. Padilha, and L. F. Ochoa. “Investigating Effects of Neutral Wire and Grounding in Distribution Systems with Faults,” 39th International Universities Power Engineering Conference, 2004 (UPEC 2004), Bristol, UK, 2004, pp. 888–892 vol. 1. [8] A. Hiranandani. “Calculation of Ampacities and Sizing of Line and Neutral Conductors in the Presence of Harmonics,” Proceedings of 1995 Industrial and Commercial Power Systems Conference, San Antonio, TX, USA, 1995, pp. 49–58, doi: 10.1109/ICPS.1995.526989.
Howard W. Penrose, PhD, CMRP, is president of MotorDoc® LLC, a veteran-owned small business. He was a U.S. Navy electric machine repair/rewind journeyman (NEC 4619/4621); is the 2022-2025 chair of standards development at American Clean Power; past chair of the Society for Maintenance & Reliability Professionals (SMRP); past chair of Chicago Section IEEE; active member of IEEE standards committee(s); and past senior research engineer at the University of Chicago Energy Resources Center. Howard is a five-time recipient of the UAW-GM People Make Quality Happen award; a leading researcher of ESA/MCSA applications; and has worked with diverse design teams from the GM hybrid Tahoe and Volt, John Deere 644 and 944 hybrid construction tractors, LVAD heart pump, flywheel generators, and high temperature/low atmosphere electric machines. He serves on the SMRP government affairs team for workforce, smart grid, cybersecurity, and infrastructure, among numerous other energy/environment/ workforce programs. Howard received his PhD in industrial-general engineering and is certified in data science and machine learning from Kennedy-Western University, Stanford University, the University of Michigan, IBM, and AWS.