
Medium-voltage cables are an integral part of modern power systems and have existed for over 100 years in various forms. Over the past 50 years, extruded cables have largely displaced paper insulated cables. Extruded cables offer many advantages over older designs, but are similarly prone to failure. Such failures are a significant impediment to improving overall power system reliability.
Since cables are often sealed systems, continual assessment is difficult, and failures often occur without warning or preparation. Figure 1, provided by the National Electric Energy Testing Research, and Applications Center (NEETRAC), compares the costs of testing equipment, replacing all equipment regularly, and running equipment to failure. Each cost is shown as a standard distribution to represent the uncertainty associated with failure costs. It is evident that the costs of testing are significantly lower and have less uncertainty than the costs associated with running equipment to failure or wholesale replacement prior to failure.
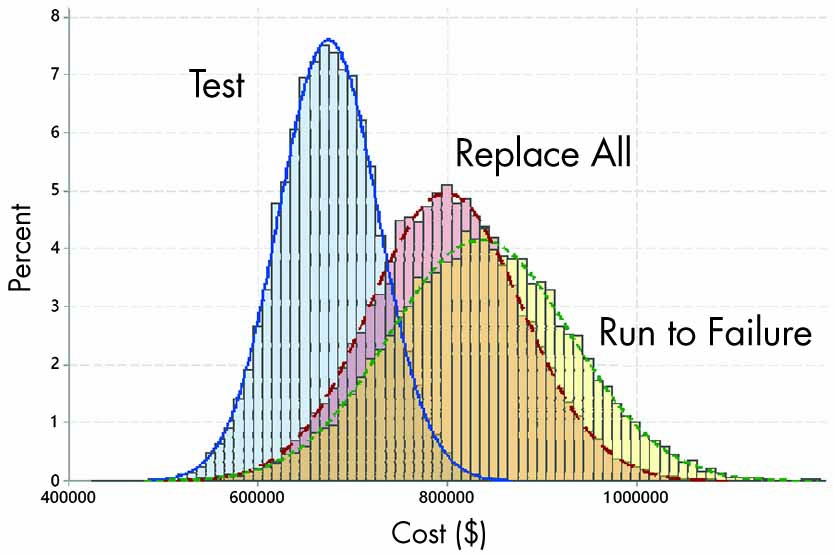
Figure 1: Cost Option Comparison
This article sets out to sample the results of multiple forensic analyses, determine the common causes of cable failures, and identify how users can acquire accurate information on the status of their cables. For the sake of this analysis, cable failures include failures in terminations, splices, connectors, and mid-cable failures. By being able to accurately determine potential cable issues before the failure occurs, we can plan better outages, improve system reliability, and prevent collateral damage caused by faults. Asset management and a proper testing schedule have been proven to lower costs associated with unplanned outages due to cable failures.
Study Background
This article analyzes a subset of the forensic investigations performed by EA Technology on failed cables and components to determine failure mechanisms and set recommendations for similar system components. This analysis can provide insight into fault mechanisms, highlight other at-risk assets, and recommend asset management strategies to reduce future risk of failure. In addition, these reports provide insight into manufacturer quality and jointer workmanship. From these reports, we try to determine proximate cause and ultimate cause.
- A proximate cause is the obvious, direct cause of the failure. Examples include moisture ingress and mechanical damage.
- The ultimate cause is the deeper, systematic reason for a failure, such as poor workmanship, lack of training, or application errors. Other potential actions leading to a systemic cause include seeking the lowest installed cost, which includes decreasing the money spent on training, buying lower grade materials, or increasing the workload on individual jointers. Another explanation can be the current labor market and how difficult it is to find and retain highly skilled jointers.
To get from the proximate cause to the ultimate cause, the authors employed a commonly used management practice called the 5 Whys. By asking “Why?” and then challenging the answer with “Why?” in a serial fashion, the ultimate cause of an event can often be found.
For example, the proximate cause of the Titanic sinking is that it hit an iceberg. While addressing that, one could overlook the ultimate cause: White Star Line had systematic issues that devalued passenger safety. The hope is that by addressing the ultimate causes of a failure, a wider range of proximate causes can be prevented. Over the course of this article, major trends are developed across both proximate and ultimate causes, and actions are recommended.
It should be noted that this study involved a small number of samples over a short period of time. While the authors believe the results to be representative of actual field conditions, this cannot be guaranteed. Sample size, time period, motivations for investigations, etc., could contribute to variations from a more detailed study. The reader should keep this possibility in mind when considering the findings presented.
Forensic Failure Investigation Process
EA Technology’s investigations begin with visual investigation of the samples and analysis of the fault timeline if provided. This is followed by review of application parameters and instructions, then mechanical disassembly. Once disassembled, analytic investigation and specialized mechanical testing is completed and a report is provided to the client detailing the findings and recommendations of the investigation.
First, a visual investigation can provide vital details on workmanship and manufacturing errors, evidence of partial discharge, and moisture ingress into the cables. This step often includes documentation of the site and failure conditions. If possible, a representative should be present for removal of the failed component to ensure no information is lost during the process. Being present also provides a better understanding of the factors leading up to the fault.
Next, the team will review the application parameters and instructions provided by the manufacturer at the time of installation. These will be used as a reference for the visual inspection and will be verified to be both accurate and clear. The visual inspection concludes with mechanical disassembly of the failed element. The cable is deconstructed layer by layer and extensively documented with pictures and measurements. This often speaks volumes about workmanship and cable age/condition.
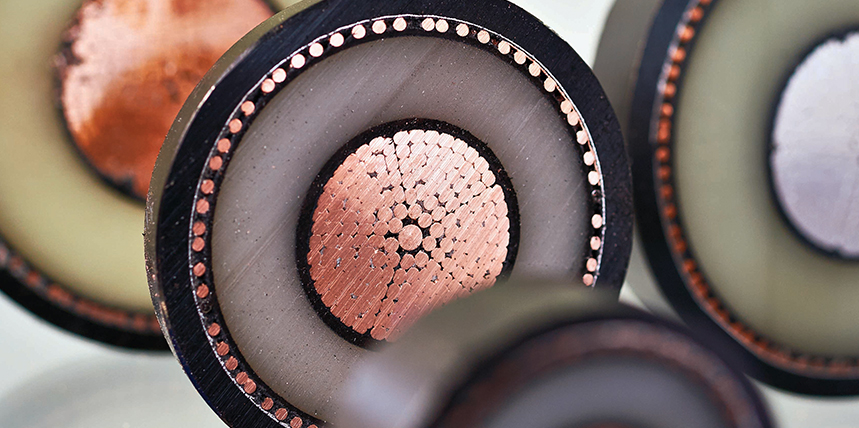
The next step is the analytical investigation. The details vary based on insulation type, but in general the analytical investigation dives deeply into suspected issues and determines the severity of underlying issues. For XLPE (Figure 2), the sample is boiled in oil of cloves to make it transparent (Figure 3). This allows the researchers to microscopically examine thin sections of insulation to visualize any inclusion and ambers from the manufacturing process. Inclusions come from foreign matter lodged in the insulation during the extrusion process. Ambers are bits of insulation that weren’t fully converted to the final material. Both can affect the dielectric constant of the insulation, but foreign materials have a more negative effect on insulation quality. Having the insulation transparent also makes it possible to see developing water trees in the insulation. These could have contributed to the fault or could indicate underlying issues based on size and location. For paper oil-insulated cables, the analytical investigation looks into the many mechanical factors that can lead to cable failure. This is done by unraveling the paper and looking for two major things:
- First, the overlapping of the strands is checked. Uneven overlapping can cause concentration of the electric fields and in turn lead to partial discharge.
- Second, the strands are checked for waxy patterns located at interstitials of the papers. These waxy residues can indicate partial discharge occurring in the cable and strongly indicate voids or moisture affecting the reliability of the cable.
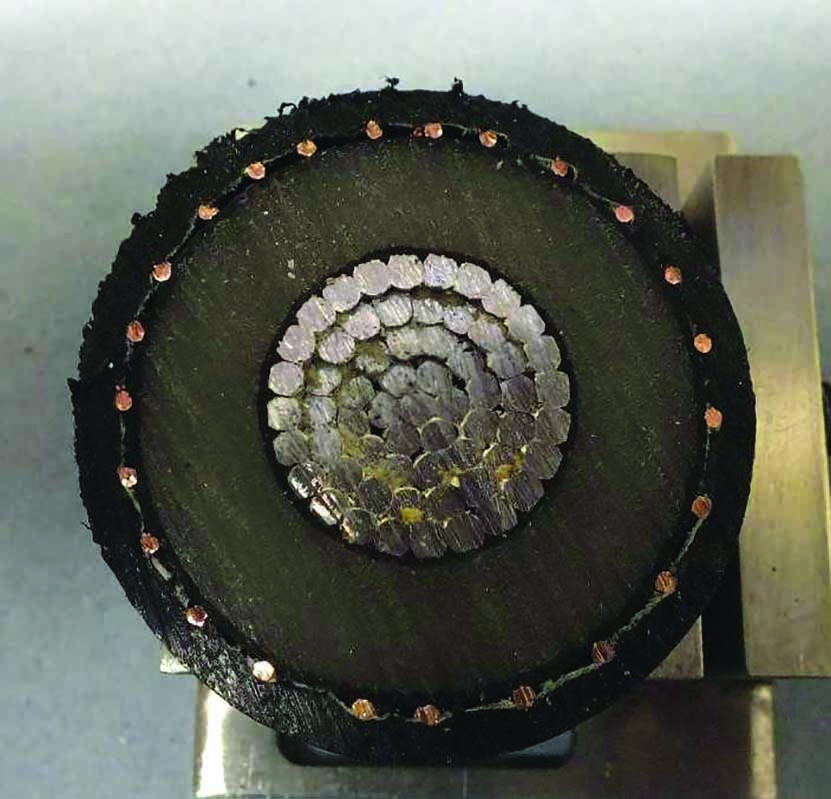
Figure 2: XLPE Insulation
Figure 3: XLPE Insulation Made Transparent
When necessary, three major specialized material tests are conducted to gather more information on the samples.
- Scanning electron microscopy (Figure 4) performs elemental analysis on inclusions to identify foreign compounds. This can be used to compare the materials in the inclusion to the bulk insulation and possibly determine the impacts the inclusion would have on dielectric constants.
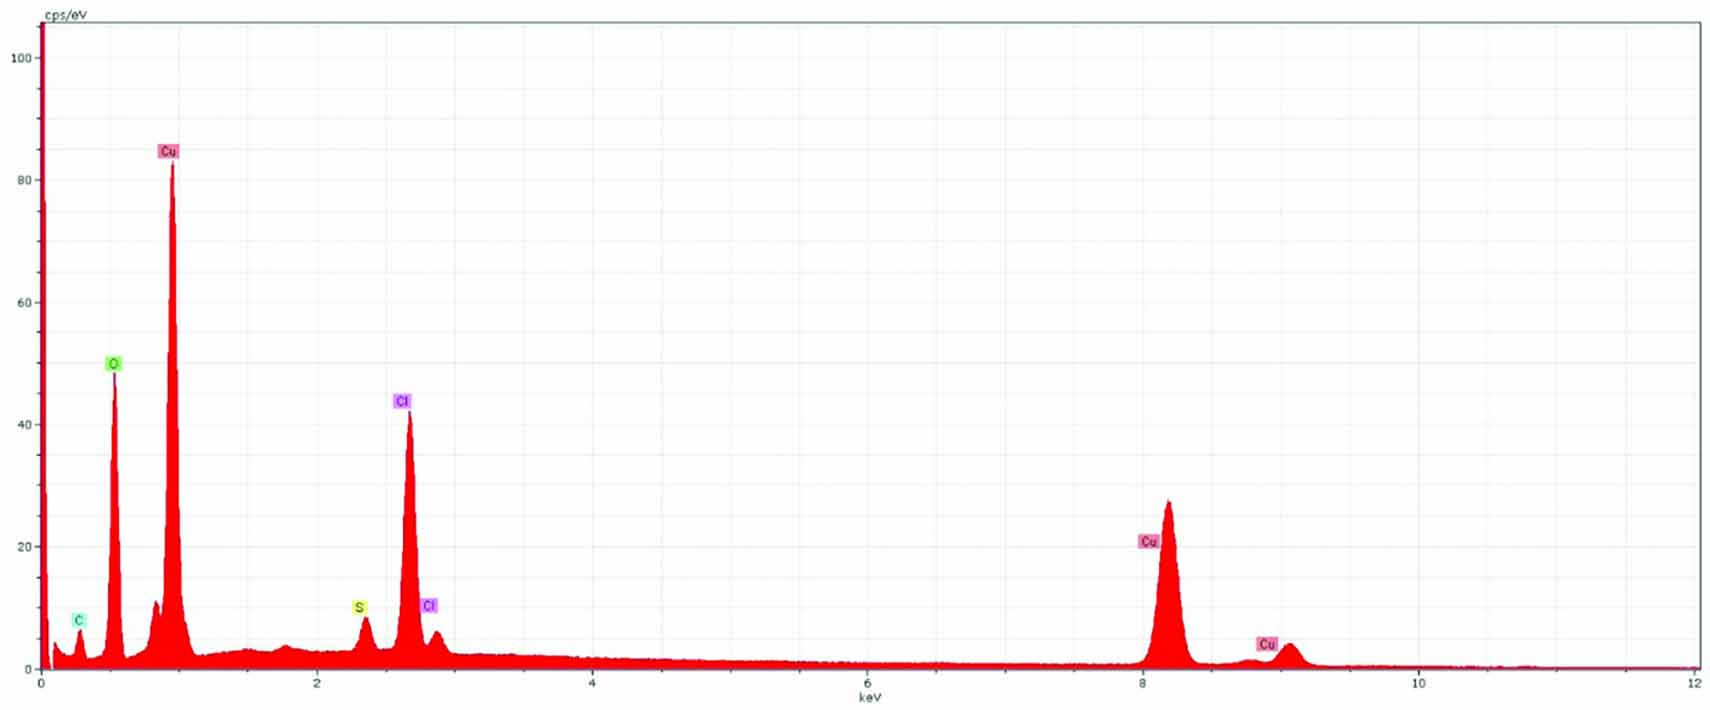
Figure 4: Scanning Electron Microscope-Based Elemental Spectroscopy
- Scanning differential calorimetry can determine the maximum temperature reached by the component prior to failure. This is important information to determine whether the component was used in the wrong application and whether overheating contributed to fault.
- Mechanical tests of cable components can determine material characteristics that indicate whether a component was appropriate for the application it was used in. This is commonly done for components expected to perform
The findings of all the tests are compiled into a report, and recommendations are drafted based on the findings. Client reports include detailed documentation of the investigation process, conclusions, and recommendations. Conclusions are structured to highlight proximal and ultimate causes of failure based on the data gathered in the report, and recommendations are provided to address the proximal and ultimate causes of the failure. The report often includes several types of recommendations.
- First, suggestions address current at-risk assets to lower the risk of failure. Cable updates are often part of a large program update, so a failed cable could indicate larger system concerns.
- Second, suggestions are aimed at internal modifications that can prevent these issues in the future. These can include a new training program for jointers or an asset management program aimed at preventing end of life failures.
- Finally, recommendations may be aimed at external factors that contributed to the fault. Examples of these are informing a manufacturer of a defect or poor design or changing suppliers to use higher-quality materials.
All recommendations build the foundation for a more reliable system with the aim of reducing failures.
This study compiles the data drawn from a set of reports to analyze the greater trends indicated by their results and recommendations. We pulled 100 reports generated in 2011–2015 from EA Technology’s forensic analysis report database. After the initial review, 27 of the reports were deemed irrelevant and discarded. Many of these were from lower voltage classes, were mechanical failures, or were a condition assessment report, not a failure analysis report. The remaining 73 reports were sorted and analyzed based on cable age, insulation type, voltage class, installation conditions, failure location, failure causes, and recommendations. These characteristics were graphed and analyzed for evident trends.
Findings
The first metric analyzed was the age of the cable when the failure occurred. It was found that failure occurrence matched the Weibull distribution — the bathtub curve pattern shown in Figure 5. Failures can be classified into three main categories:
- Infant mortality failures make up the largest segment of the graph and last for approximately 10 years after installation.
- Random failures occur for the next 30 years or so. These are intermittent and generally uncorrelated.
- At around 40 years after installation, end of life failures begin to occur.
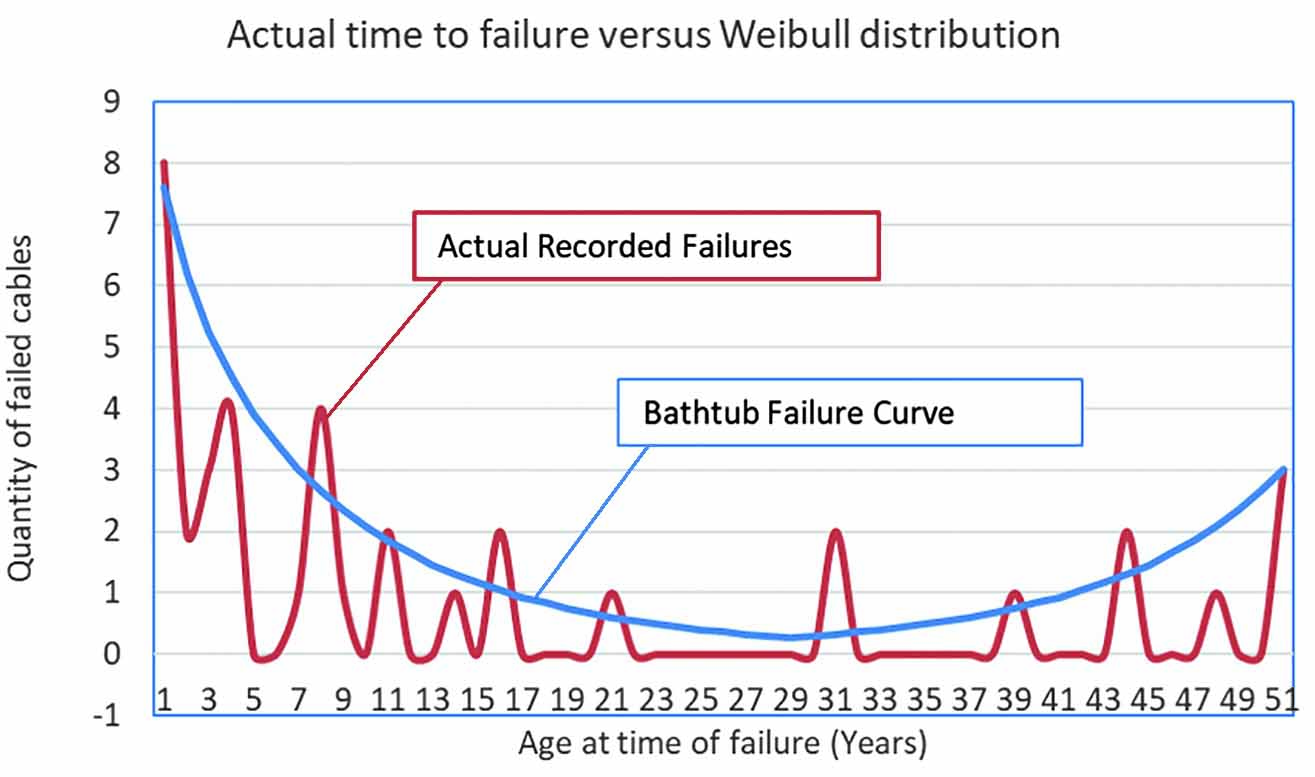
Figure 5: Time to Failure
End of life failures are generally only prevented by replacement, while infant mortality and random failures can be prevented by looking deeply into the causes and responding appropriately.
Next, the report samplings were analyzed across insulation type and fault type (Figure 6). Based on “Historical Overview of Medium- and High-Voltage Cables,” written by the Georgia Tech NEETRAC group, XLPE and PILC cables show a similar ratio of failures per mile of installed cable. The ratio of failures per mile was developed using the data about EPR usage compared to XLPE usage provided by NEETRAC. Comparing NEETRAC’s average percentages per insulation type versus this study’s average percentages of failures per insulation type takes into account that EPR is less commonly used than XLPE. This factor may have swayed the data to make EPR look dramatically more reliable than XLPE. While the numbers presented are backed by the various reports referenced, the difference in field failure rates for insulation types is unlikely to be as great as this specific study implies due to external factors not accounted for in this analysis.
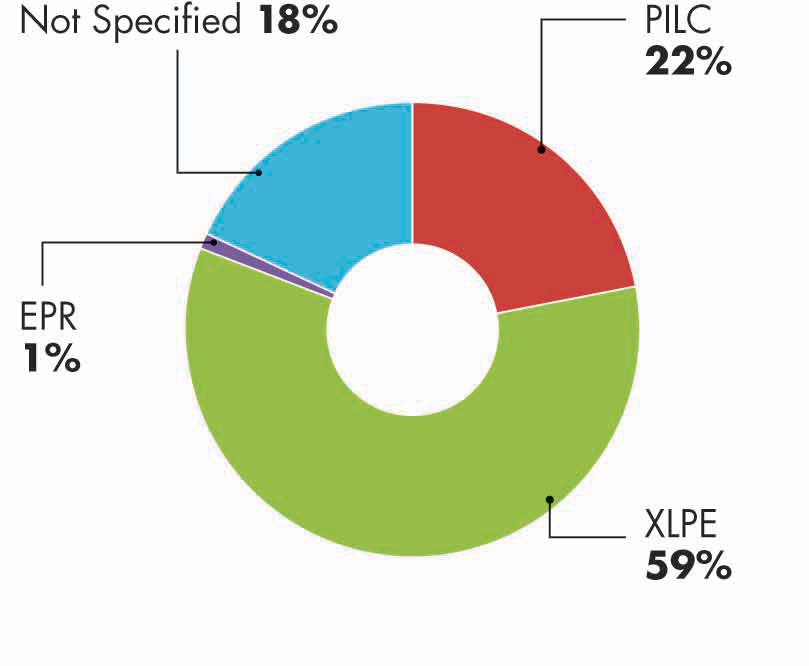
Figure 6: Failure Rate by Insulation Type
Next, we analyzed where the failures occurred (Figure 7). Based on the fault locations seen in the report sampling, 68% of failures occur in places where technicians are working on cables in the field versus 25% of failures mid-cable where technicians likely have had little interaction with the cable. Clearly, the act of working on the cable in the field can introduce failures. Explanations for the mid-span failures include mechanical damage before or during installation, incorrect application, manufacturing defects, or simply random failures without a clear reason.
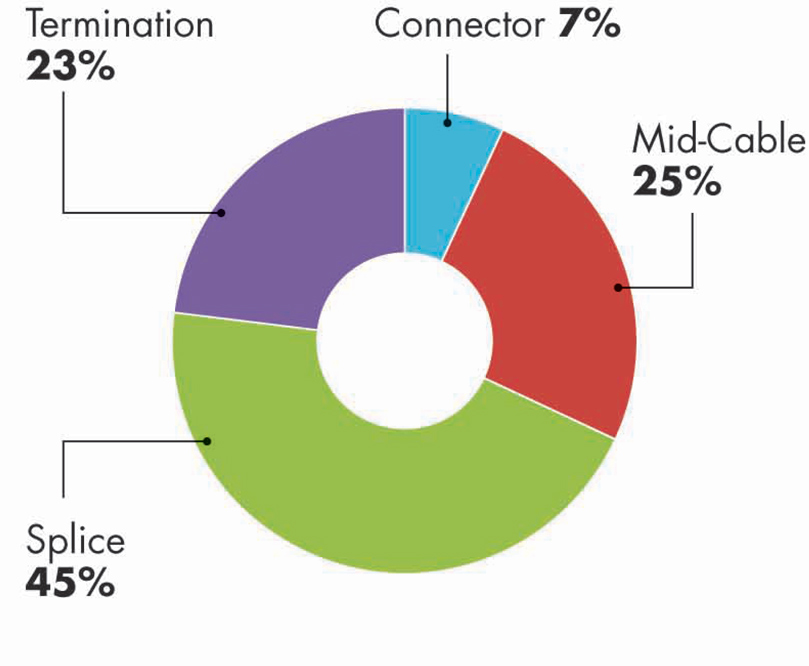
Figure 7: Fault Location
We next characterized and plotted the proximate causes of failure (Figure 8). Reviewing the proximate causes of failure revealed several interesting trends. Assembly mistakes cause 43% of failures commonly found. This indicates a lack of effective communication between manufacturers and installers or in training of jointers. Another 40 percent is due to preventable damage to the cable, either from moisture or mechanical damage. Small percentages can be attributed to contaminants, circulating currents, and overheating.
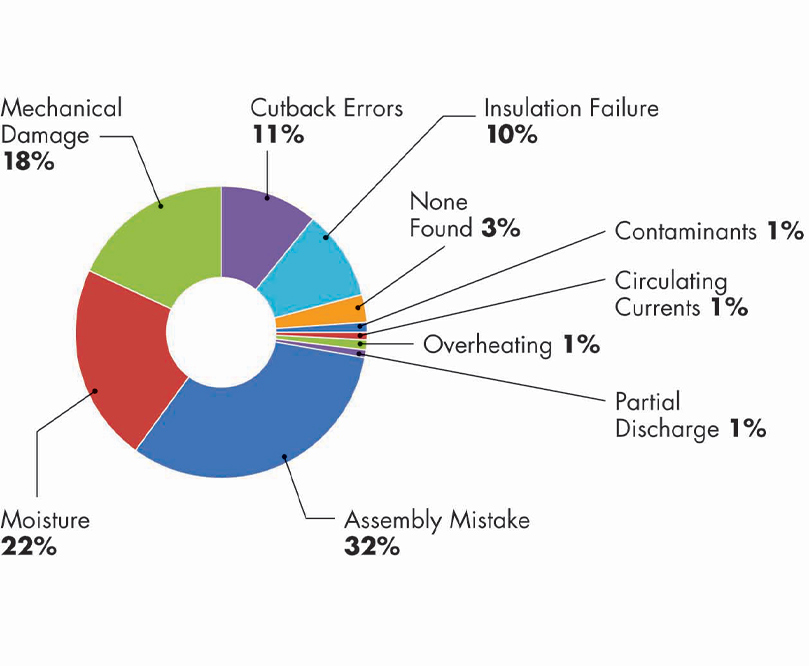
Figure 8: Proximate Causes of Failure
What is missing from this picture is the detail of what is causing these failures. Proximate cause provides insight into what happened, but often lacks the complexity of the full reasoning behind a fault. Looking at the ultimate causes of the sampling (Figure 9), we see that the vast majority of faults can be attributed to workmanship errors. These include errors in jointing due to negligence or inexperience, as well as sloppy work and lack of care. Six percent of failures were due to age, which is lower than expected based on the correlation to the Weibull distribution discussed earlier. Manufacturing defects presented about 11% of all ultimate causes, which is higher than expected. These range from contaminants in the insulation to violation of conductor spacing requirements in the brand new cables. In just 4% of cases, no ultimate cause was found, which suggests steps can be taken to address the vast majority of cable failures.
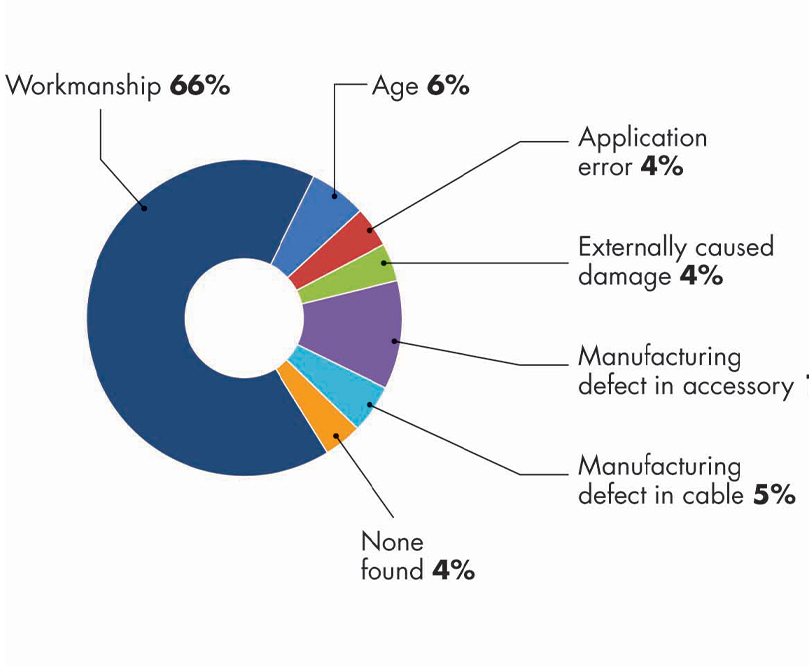
Figure 9: Ultimate Causes of Failure
Based on the ultimate and proximal causes of failure, several standard recommendations would help prevent future failures (Figure 10). The most commonly recommended action was to perform partial discharge mapping regularly. Partial discharge is cyclic breakdown of part of the insulation system due to a localized electric field greater than the dielectric withstand capability of that part, while the overall insulation system remains capable of withstanding the applied electric fields. Partial discharge, commonly found surrounding voids in the insulation, produces a variety of detectable byproducts such as heat, light, sound, scent, electromagnetic waves, and a high frequency electric current. Since the prevalence of partial discharge can indicate issues with insulation quality, routine partial discharge mapping can help clients plan for outages to address issues before they escalate. Cable partial discharge testing can provide data about how aging and conditions have affected installed cable and help prioritize replacement and repair.
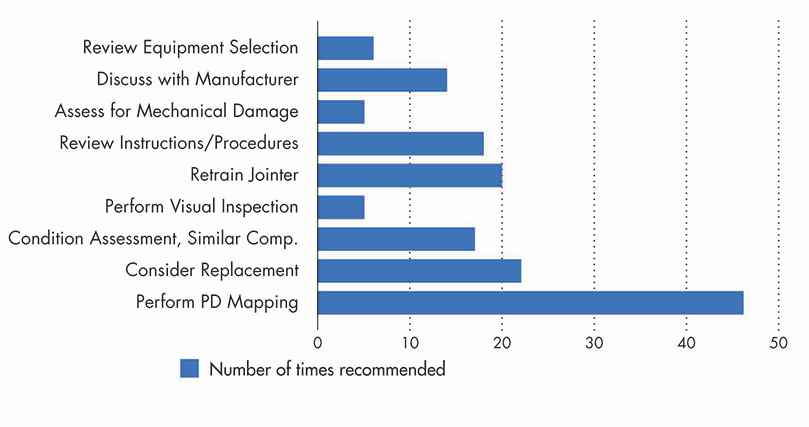
Figure 10: Recommended Actions for Existing Equipment
Replacement is a commonly recommended action, yet it is regarded as only one of many options. The prevalence of partial discharge mapping and condition assessment recommendations suggests that proper asset management techniques can help prevent untimely replacement of working equipment by providing additional information about its operating condition. Discussing the fault with the manufacturer was also commonly recommended. By having clear and open communication with the manufacturer, installation errors or application errors are less likely. Similarly, since 11% of faults occur because of manufacturing defects, it is important to have clear quality expectations for the manufacturer. Providing feedback on failed components can prevent future quality issues from costing the user so much long term. Visual inspection is relevant for some faults, but it is considered to be of a limited value since most problems are hidden. This reinforces the value of partial discharge mapping, which provides data about cable condition and longevity that cannot be gathered from visual inspection alone.
Recommendations aimed at preventing failures in future installations (Figure 11) center around providing high-quality training for jointers and ensuring that instructions and procedures are clear and set the technician up for success. Well-trained jointers are key to having a reliable system because such a high percentage of faults can be traced to jointing issues. Talking to manufacturers throughout the process of a program upgrade can ensure instructions are being accurately followed. Finally, choosing the correct equipment for the application is frequently recommended since application errors caused about 4% of the failures from this sampling.
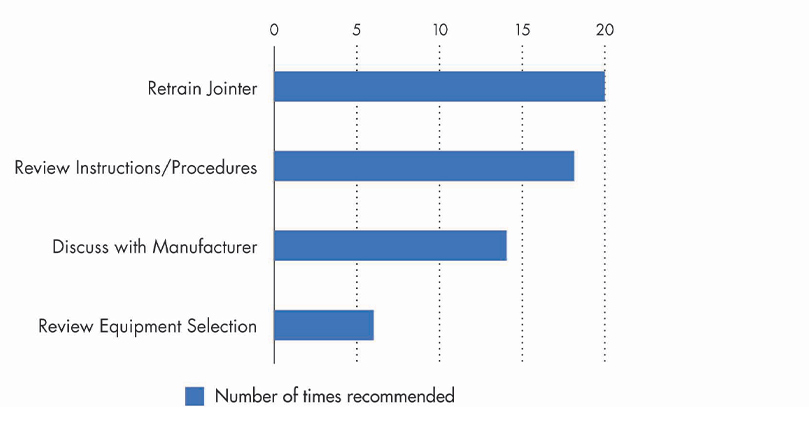
Figure 11: Recommended Actions for New Installations
Examples
The first example is an 11 KV PICAS to XLPE branch adapter that failed one hour after installation (Figure 12). The proximate cause was determined to be incorrect positioning of the adapter tubes. Therefore, workmanship errors were determined to be the ultimate cause of failure. Investigation found many quality issues: Shear bolts were misaligned, there was no putty in the shear bolts, the tubing was poorly cut, and there were gaps in the insulation throughout the sample. Common recommendations for these conclusions include retraining the jointers and assessing the components as a part of the project. This example highlights that finding and fixing the proximate cause of the failure is not adequate. Several mistakes all could have led to failure had the first cause not been present. By addressing the ultimate cause of jointer training, all of the workmanship issues and potential failure points would be addressed.
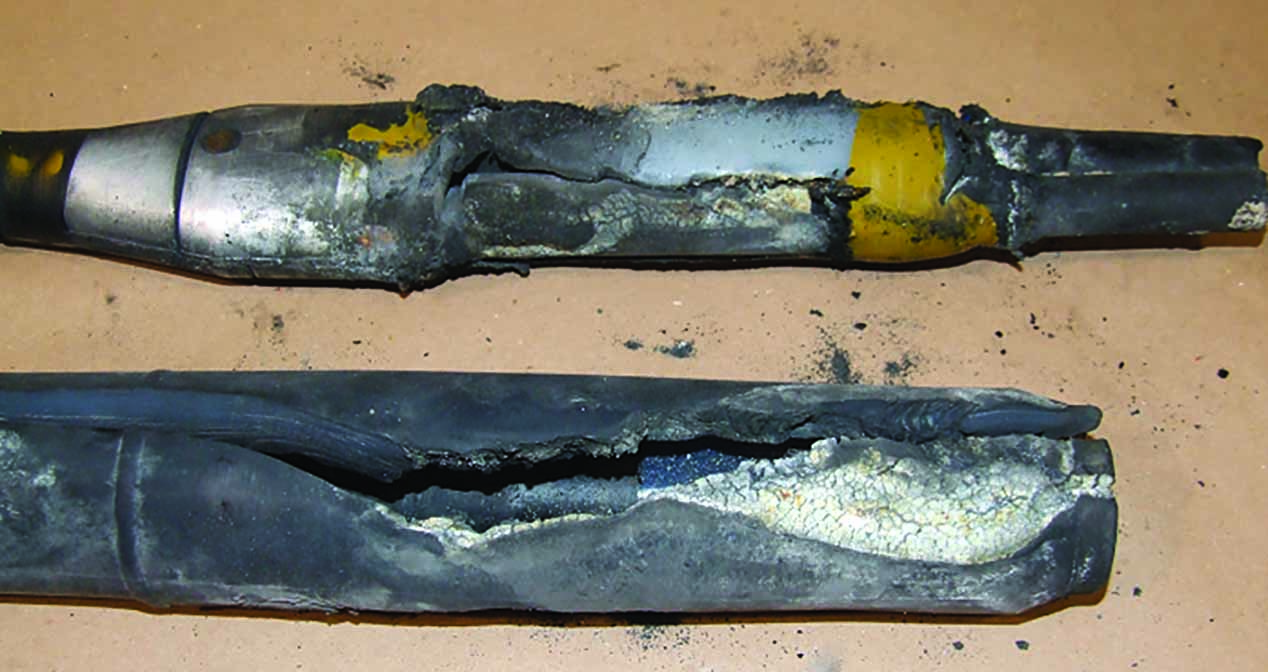
Figure 12: XLPE-PICAS Joint
The next example explored a 33KV XLPE joint that failed after 18 months in service. The fault hole is visible through the insulation in Figure 13. The failure occurred because the jointer did not properly deburr a connector. The sharp edge caused mechanical damage and created a concentration of electric fields in the damaged insulation. The takeaway: Poor understanding of instructions, lack of attention to detail, and lack of training all contributed to the failure of this joint.
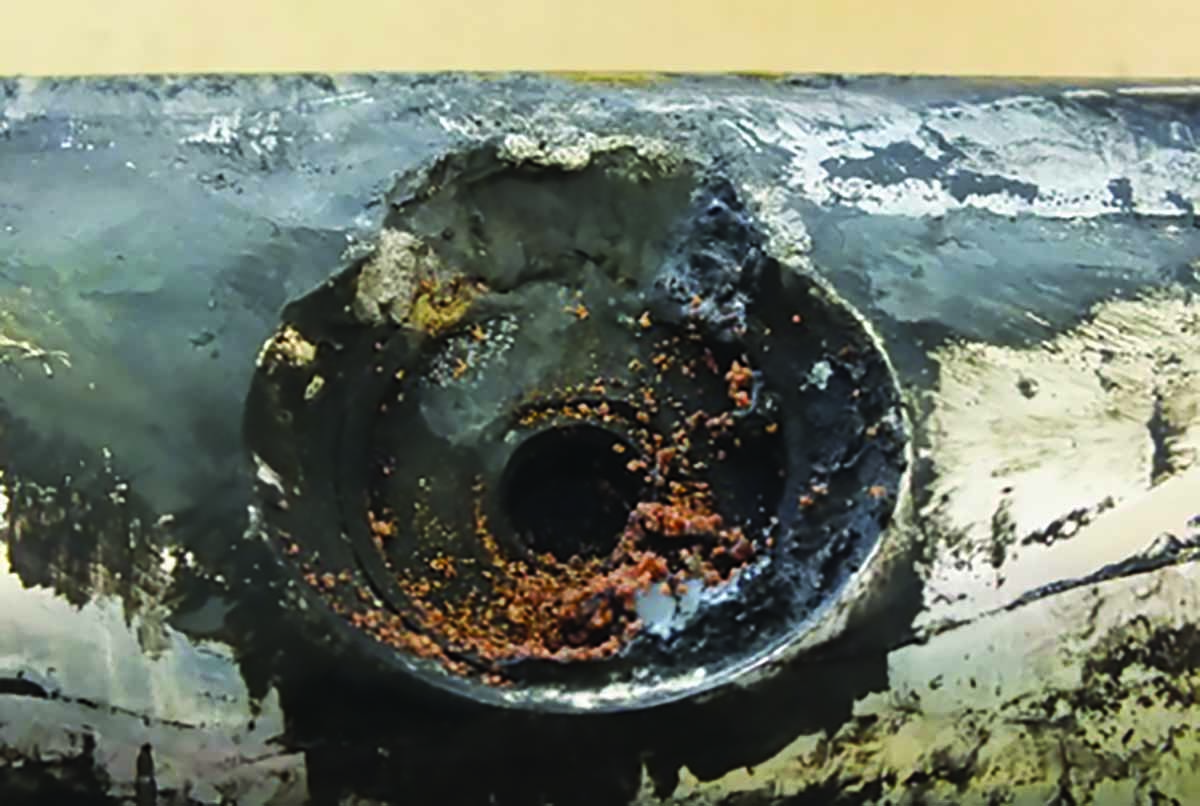
Figure 13: Failure Location on 33KV XLPE Joint
The final example explored an 11 KV PILC cable that experienced a mid-cable failure after 47 years of service (Figure 14). This failure is a result of age-related partial discharge. Although this cable was in service for an appropriate life span, it is an example of how partial discharge mapping could have prevented an unplanned failure. Catching the partial discharge earlier would have allowed the client to plan an outage to address the issues.
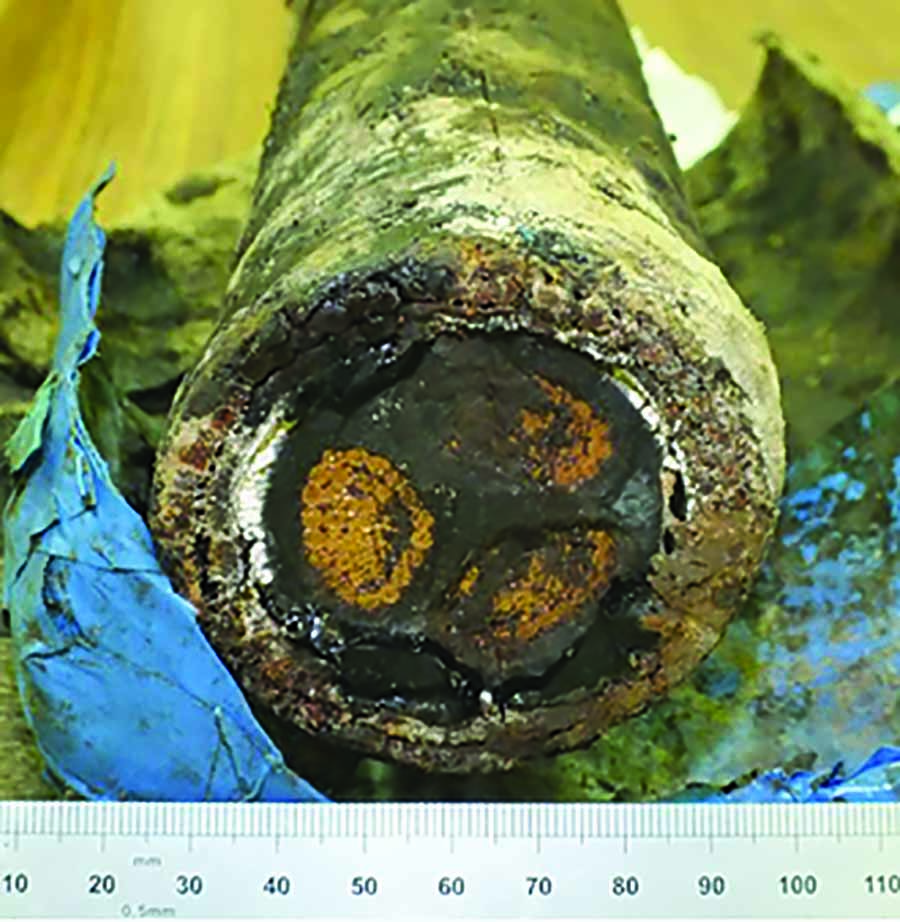
Figure 14: Failed PILC Cable
Conclusions
With cable failures costing clients significantly every year, identifying trends in occurrences can help reduce future failure-related costs. Forensic analysis allows the community to learn from past failures to promote a more reliable and robust system. The following conclusions were drawn from the investigation of 73 forensic analysis reports:
- Cable faults follow a predictable reliability curve and generally can be expected to fail within the first 10 years or after 40 years in service. With about 35% of failures occurring in the first ten years, it is vital to install cables carefully to prevent the majority of infant mortality-related faults.
- Ensuring installations are done following clear and accurate manufacturer’s instructions can prevent 2/3 of faults.
- Since human error is inevitable in every field, a proper asset management program founded on partial discharge testing can help identify and prioritize issues as they develop.
Furthermore, since faults are inevitable, performing a forensic analysis post-mortem can help diagnose the causes of failure and identify trends in the failures associated with a company and suppliers. Although universal trends were shown through these reports, these do not necessarily indicate that every company should prioritize the recommendations in the same manner. For example, Company A may have excellent jointers but poor quality cables; Company B may have the highest quality components, but a few subpar practices are affecting their installations.
A custom assessment and recommendations may expose problems specific to your company or installations. Forensic analysis provides a much more detailed analysis than field review and can even help prevent future failures by looking deeper than proximal causes. Even in cases where there is no evident root cause, every investigation adds to our knowledge base and helps us create more reliable systems in the future.

Kelly Higinbotham started her career at Burns & McDonnell as a Substation Engineer in 2018 following graduation from the University of Connecticut with a BS in electrical engineering and a minor in mathematics. She is an Engineer in Training (EIT) in the state of Connecticut and looks forward to pursuing her Professional Engineer license in the next several years. Outside of her professional commitments, Kelly serves as an Alumni Advisor for the University of Connecticut chapter of Phi Sigma Rho, a national sorority for women in engineering.
 William G. Higinbotham has been President of EA Technology LLC since 2013. His responsibilities involve general management of the company, including EA Technology activities in North and South America. William is also responsible for sales, service, support, and training on partial discharge instruments and condition-based asset management. He is the author or co-author of several industry papers. Previously, William was Vice President of RFL Electronics Inc.’s Research and Development Engineering Group, where his responsibilities included new product development, manufacturing engineering, and technical support. He is a senior member of IEEE and is active in the IEEE Power Systems Relaying Committee. He has co-authored a number of IEEE standards in the field of power system protection and communications, and holds one patent in this area. William received his BS degree from Rutgers, the State University of New Jersey’s School of Engineering, and worked in the biomedical engineering field for five years prior to joining RFL.