
Medium-voltage (MV) cables serve as the backbone of a distribution system, playing a vital role in ensuring the reliable supply of electricity. However, maintaining this extensive network comes at a significant cost for operators. Off-line partial discharge (PD) testing emerges as a valuable tool in managing operating costs and enhancing the reliability of MV cable systems. By transitioning from traditional to proactive maintenance approaches, operators can identify and localize potential issues before they escalate into costly failures.
While there are well-established standards for interpreting factory acceptance tests and field acceptance tests, the interpretation of PD test reports from maintenance field testing requires more attention and expertise. Unlike acceptance tests, which focus on ensuring the initial quality of newly installed cables, maintenance testing aims to identify weak spots in the insulation of cables already in service.
PD reports offer valuable insights into the condition of insulation within MV cables, helping asset managers make informed decisions regarding the health and reliability of the cables. By analyzing specific items within these reports, a clearer assessment of insulation performance can be achieved.
The PD test report generated from maintenance field testing contains valuable information that can effectively guide maintenance decisions and resource allocation. However, using this information requires a thorough understanding of various factors — including PD levels, PD count, location of defects, PDIV, PDEV, and background noise levels — to properly interpret the results. This interpretation process demands experience and expertise to distinguish critical issues from minor abnormalities and make informed decisions regarding maintenance actions.
This article aims to provide a comprehensive understanding of critical items found in PD reports and their significance in assessing the health of insulation in MV cables. Additionally, it proposes a table that can be used as a tool to evaluate and interpret these test reports effectively.
PDIV, PDEV, AND BACKGROUND NOISE
Partial discharge inception voltage (PDIV) and partial discharge extinction voltage (PDEV) are crucial parameters in partial discharge testing for assessing the condition of insulation systems.
PDIV represents the voltage level at which partial discharges — localized electrical discharges within insulation — begin to occur during testing. PDIV serves as an indicator of potential weaknesses or faults in the insulation.
PDEV signifies the voltage level at which the partial discharges are no longer present or have been completely extinguished.
PDIV and PDEV are critical criteria for interpreting PD test results. However, for accurate interpretation, additional parameters need to be considered. In field testing, the instrument may not be able to measure PDs below the background noise (disturbance) level. Therefore, it is crucial to take the background noise level into account to achieve more accurate interpretations. By considering the background noise level, engineers and technicians can enhance the precision of their assessments and make informed decisions regarding the maintenance or replacement of the cable’s insulation system.
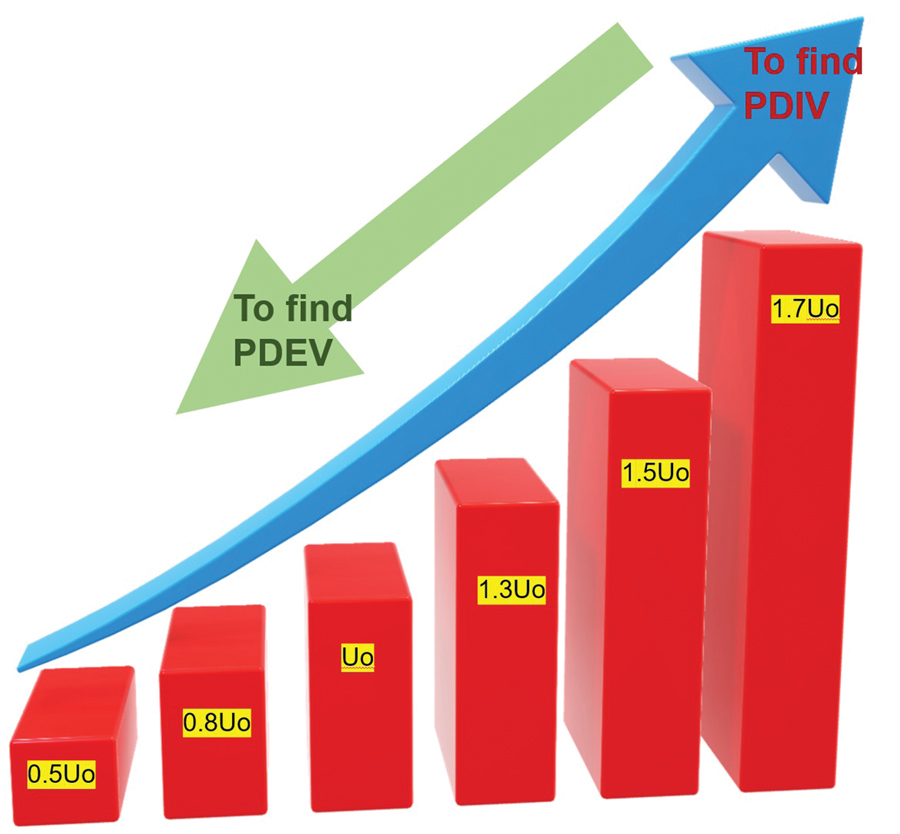
Figure 1 depicts the process of determining PDIV and PDEV through the application of step-up and step-down voltages. This visual aid showcases the use of 1.7 Uo, which is specifically chosen for maintenance purposes (2 Uo is used for acceptance tests). The figure effectively demonstrates the voltage adjustment procedure required to accurately assess PDIV and PDEV values.
LOCATING PD AND MEASURING CABLE SHEATH QUALITY
To properly interpret a test result, we must know the location of the PD defects.
Locating defects in cables and accessories is one of the main advantages of PD testing of MV cables.
PD pulses, when present in MV cables, travel through the cable in a manner like those of time domain reflectometry (TDR) technology widely used in the industry. As PD pulses propagate along the cable, they experience certain characteristics and challenges influenced by the cable’s length and the quality of its sheath.
When a PD event occurs within the insulation of an MV cable, it generates a high-frequency electrical pulse. This pulse travels along the cable, reflecting and attenuating as it encounters impedance changes, faults, or imperfections in the cable’s accessories.
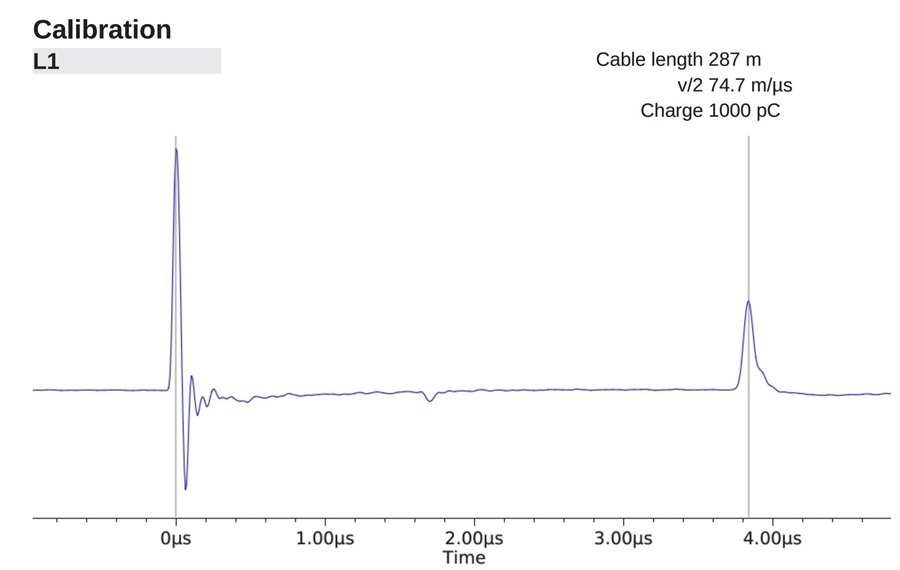
During the calibration procedure, the operator sends a similar pulse and measures reflections from joints and the far end of the cable. The injected pulse is like a single PD pulse. The calibration provides a signature of the cable including the location of joints. This fingerprint of the cable and the amount of calibration charge is essential to interpret the test result.
Figure 2 illustrates the calibration pulse and its reflection from the far end of the cable. The displayed signature indicates the presence of a potential joint or connection in the middle of the cable. The calibration process involved injecting a charge of 1,000 PC into the cable, allowing for the identification and analysis of any reflections.
Corona Discharges from Cable Ends
PD events can occur between the cable ends and the surrounding air, resulting in what is known as corona discharges. These discharges may appear in the PD test report and can be identified at the near or far end of the cable. It is important to note that corona discharges between the conductor and air do not pose a significant threat to the insulation. Therefore, it is not desirable to include them in the test report, as they can obscure real PD pulses originating from the inner insulation. The presence of corona discharges can potentially mislead the interpreter into identifying the cable termination as faulty, when in fact, the PD is stemming from corona discharges.
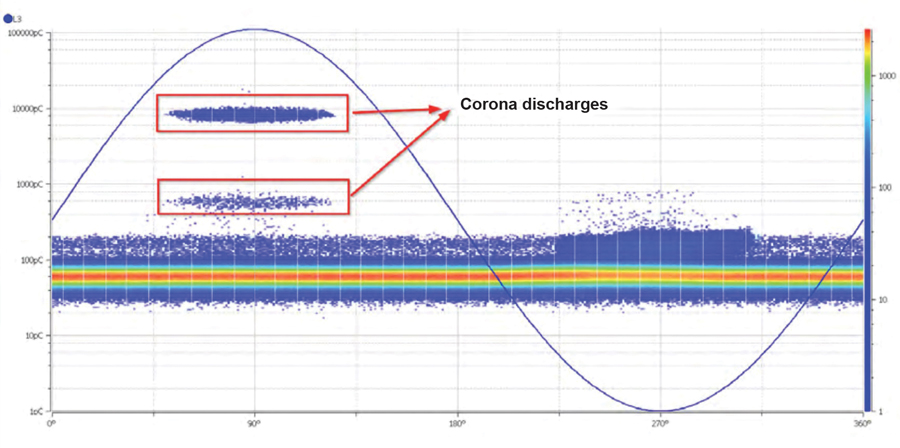
To overcome this challenge, phase-resolved partial discharge (PRPD) patterns prove useful in recognizing corona discharges. By analyzing the PRPD patterns, interpreters can differentiate between corona discharges and other types of PD occurring in the cable. This distinction is essential in ensuring accurate and reliable interpretation of the test results.
Furthermore, the use of anti-corona connections, such as corona rings, is recommended to improve the accuracy of the PD test. These specialized connections help mitigate corona discharges, reducing their occurrence and minimizing their impact on the test results. By employing anti-corona connections, the interpreter can obtain more precise and trustworthy data, facilitating a more accurate assessment of the cable’s condition and avoiding unnecessary replacements or repairs based on misleading information. Additionally, PRPD patterns help distinguish between different types of partial discharge.
Figure 3 serves as an example of identifying corona discharges through PRPD patterns. Corona discharges typically occur at the peak of the positive or negative cycle (90 degrees or 270 degrees) and exhibit a relatively flat, horizontal characteristic. The illustration highlights the distinct PRPD pattern associated with corona discharges, aiding in their recognition and differentiation from other types of partial discharges.
PD Level and PD Count
PD level and PD count are two important parameters that can provide insight into the severity of defects on a cable during partial discharge (PD) testing.
PD level refers to the magnitude or amplitude of the partial discharge activity detected during testing. It represents the intensity of the electrical discharges occurring within the cable’s insulation. Higher PD levels indicate a greater amount of energy being released, which can suggest the presence of more severe defects or faults within the insulation system.
PD count refers to the number of individual partial discharge events detected within a specific time frame or cycle. A higher PD count indicates a more frequent occurrence of PD events, which can indicate a higher density or larger number of defects in the cable. Increased PD count suggests a higher likelihood of multiple fault locations or more widespread deterioration of the insulation. This parameter provides valuable information about the extent and distribution of defects within the cable.
By analyzing the PD level and PD count, the operator can gain a comprehensive understanding of the severity of defects present on the cable. Higher PD levels combined with a significant PD count may indicate the presence of critical faults or deteriorations. However, the location of the defect is also extremely important. A small PD pulse in a cable is not comparable with strong PD pulses in cable accessories as we know that accessories are designed to tolerate stronger PD than the cable itself.
Additionally, PDIV tells us if PD is occurring during the normal operation of the cable. If we get strong PD pulses below operating voltage, the situation is much more critical than having these pulses near 1.7 times operating voltage.
It is important to note that the specific thresholds for PD level and PD count may vary depending on the location of defects, the presence of PDIV, the application, and the measuring instrument.
Some research shows that PD levels measured by different instruments are not comparable even if they use the same IEC 60270 standard. Moreover, PD amplitude and counts are dependent on the applied voltage shape — very low frequency (VLF), damped alternating current (DAC), or cosine rectangular (CR) and frequency.
INTERPRETING TEST RESULTS
Table 1 provides a suggested set of rules for categorizing tested cables into five distinct categories. A cable classified as Cat 1 would require immediate action, while a Cat 5 designation indicates no detection of PD. The suggested actions within each category depend on the asset manager’s preferences, required reliability levels, and budget constraints. The primary objective of this entire procedure is to enhance reliability while reducing operational costs.
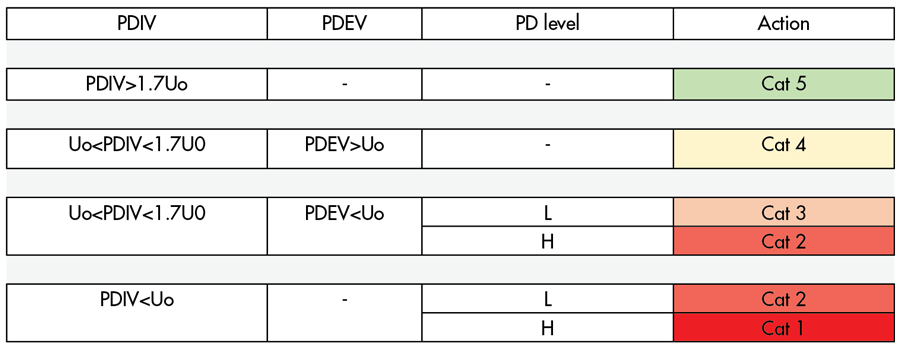
It’s important to note that this table is specifically designed for maintenance testing conducted under moderate background noise conditions (approximately 150 PC) and a calibration pulse of 1 NC (nano-coulomb). However, this table can still serve as a reliable guideline for testing in various other conditions.
The table does not specify a specific PD level for judgment regarding PD level, as it varies depending on the instrument used and the shape of the applied voltage. Therefore, it is essential for the operator to establish their own criteria for determining the PD level. However, a common practice is to categorize PD levels as either high or low based on a threshold of 1 NC, which helps facilitate a more practical interpretation of the results.
Critical Cable
If the cable under test is a main feeder or requires a higher level of reliability than usual, the definitions of the categories must be adjusted accordingly. While the overall interpretation of the test results remains the same, the specific criteria within each category may need to be modified to align with the increased reliability requirements. It is important to adapt the categorization to suit the specific needs of critical cables, ensuring that the actions taken are appropriate for maintaining the desired level of reliability.
PD in Cable Main Insulation
PD testing typically focuses on assessing the condition of cable accessories. However, there are certain cases where defects may be detected in the main insulation of the cable. It’s important to note that these types of defects often result in lower PD levels compared to accessories, but they can develop rapidly. As a result, if the PD report indicates the presence of PD originating from the main insulation of the cable at any voltage level, it should be classified as requiring immediate action and categorized as Cat 1. Prompt attention and appropriate measures should be taken to address these critical issues and ensure the integrity of the cable’s main insulation. One of the best practices is to conduct a withstand test using VLF for an hour, ensuring the cable’s reliability and preventing potential failures in service.
Field Acceptance Test
For the acceptance test of a new cable, it is recommended to apply a maximum voltage of 2 Uo instead of 1.7 Uo. The industry standards simplify the interpretation process for acceptance testing. If any PD is detected below 2 Uo (i.e., if PDIV is less than 2 Uo), the cable is considered to have failed the test. Background noise can affect the accuracy of the acceptance test, as the test set is only capable of detecting partial discharges above the level of background noise. Consequently, the test report for the acceptance test should consider the presence of noise and its potential impact on the results.
SUMMARY
Interpreting PD test results for maintenance purposes, particularly in the presence of background noise, poses certain challenges. However, the interpretation of these results holds significant importance as it directly relates to budgeting and operational costs for MV cable systems.
This article provides a suggested table to serve as a guideline for interpreting test results, assisting decision-makers in effectively managing limited budgets. It emphasizes the need to consider various factors such as the location of PD, PDIV, or PDEV; the criticality of the cable; and the background noise level to accurately interpret the test results. By considering multiple criteria for assets, managers can optimize maintenance strategies, enhance cable reliability, and allocate resources effectively.
REFERENCES
International Electrotechnical Commission. IEC 60270, High-Voltage Test Techniques —Partial Discharge Measurements, Edition 3.1.
IEEE. IEEE Std. 400-3, IEEE Guide for Partial Discharge Testing of Shielded Power Cable Systems in a Field Environment, 2006.
N. Jäverberg, H. Edin. “Applied Voltage Frequency Dependence of Partial Discharges in Electrical Trees,” Proceedings IR-EE-ETK, Stockholm, Sweden, 2009.
D. Götz, F. Petzold, H. Putter, S. Markalous, and M. Stephan. “Localized PRPD Pattern for Defect Recognition on MV and HV Cables,” 2016 IEEE/PES Transmission and Distribution Conference and Exposition (T&D), 2016, pp. 1-4,
doi: 10.1109/TDC.2016.752005.

Shahryar “Sha” Farhang, P.Eng, is an Applications Engineer at Megger, where he specializes in partial discharge testing and online monitoring. His expertise lies in providing technical and engineering support for both on-line and off-line PD testing of medium-voltage cables, transformers, and gas-insulated substations. Prior to his current role, Sha Farhang collaborated with Magna IV Engineering on numerous commissioning and maintenance projects involving medium- and high-voltage systems in the US, Canada, and Chile. Sha is a Professional Engineer (P.Eng), an experienced electrical field engineer, and a Master Electrician in the United States and Canada. He earned his BS in electrical and electronics engineering at Razi University in Kermanshah, Iran, and an MS in information technology and econometrics at the University of Information Technology and Management (UITM) in Rzeszow, Poland.