
Due to the complex temperature-driven dynamics of the exchange of water between the paper insulation and the oil and the lack of thermal equilibrium in most operating transformers, it is difficult to interpret the water content of oil or paper insulation by looking at individual dissolved-water measurements or time-series data. Furthermore, increases in water solubility due to aging of oil make it risky to rely on relative saturation calculated from dissolved-water measurements based on the assumption that the oil is like new.
A thermodynamic approach to assessment of water in transformers, starting with the recognition that water solubility is a thermodynamic equilibrium constant, solves these problems. Expressing water solubility in terms of Gibbs energy shows how to estimate water solubility in aged oil accurately and also how to quantify the degree of aging. From the hysteresis of water concentration in oil varying with temperature, it is possible to estimate the active water content of insulating paper and to identify transformers whose wetness threatens to lower the oil’s dielectric breakdown voltage or cause the oil to approach 100% water saturation during temperature changes. Throughout this discussion, “paper” refers to thin cellulosic insulation. In a power transformer, most is kraft paper, but some may be pressboard.
Water Content in Paper
A new power transformer is expected to have a water content in paper insulation (WCP) of less than 0.5% by weight. It is filled with mineral oil processed to have less than 10 mg/kg of water in accordance with IEEE C57.106. To put this information in perspective, a new transformer with 5,000 kg of paper insulation and 20,000 kg of oil would have less than 25 kg of water in the paper and would be filled with oil containing less than 200 g of water.
It is highly desirable to keep WCP below one percent, but since water is a by-product of aging-related deterioration of paper and oil, the insulation in a transformer gradually becomes more moist. Over two or three decades, normal aging can increase the water content of the paper insulation to notebook paper’s natural moisture level of about 4–5%. If there is a leaky gasket or seal or if there is a breather with depleted desiccant, the transformer can breathe in humid air, greatly accelerating the accumulation of water in the oil/paper system. Actually, since the bottom of the transformer is normally cooler than the top, the paper insulation at the bottom of the windings becomes wetter than at the top. At or before the 4% level of WCP, a well-cared-for transformer may be subjected to a dry-out.
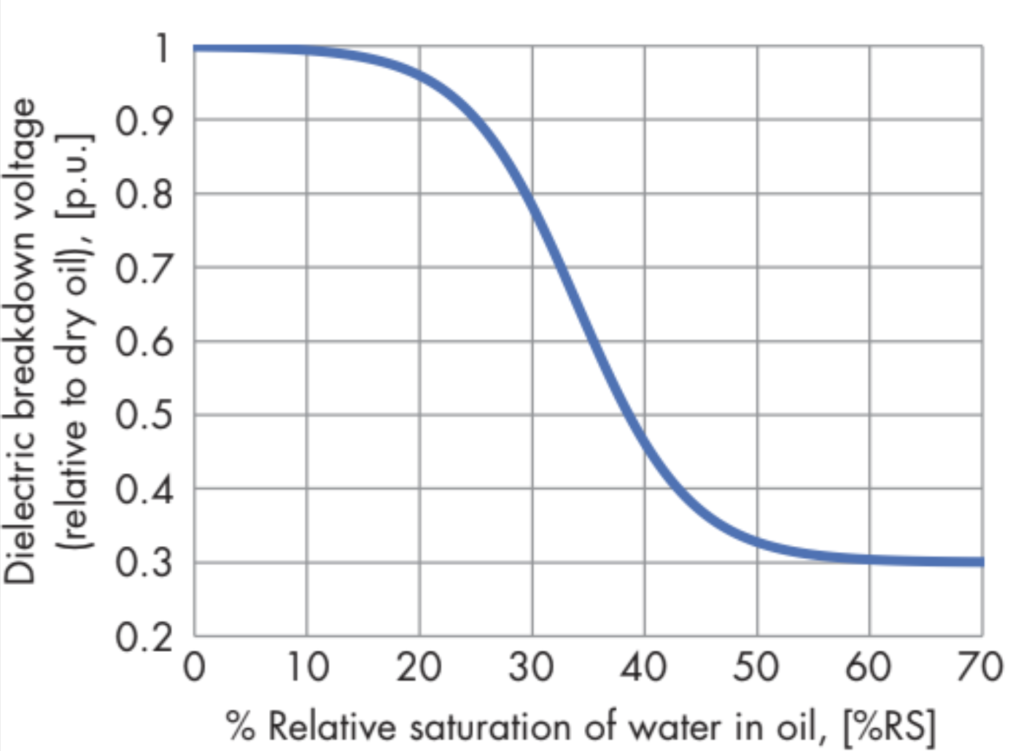
Figure 1: Dielectric Breakdown Voltage (Relative to Dry Oil) as a Function of Relative Saturation of Water in Oil
Why is water so undesirable in a transformer? Water, oxygen, and high temperatures are important factors in accelerating the degradation of transformer insulation. Water in oxidized transformer oil can degrade paper insulation by hydrolysis. Water vapor bubbles, which are very detrimental to dielectric strength, can form in paper insulation when winding conductor temperature increases sharply if the paper is not extremely dry. Figure 1 shows how the dielectric breakdown voltage of transformer oil decreases as the relative saturation of water in oil increases. All of these negative effects of water in transformers are discussed in detail in Paul Griffin’s paper.
The most common method of tracking water in a transformer with mineral oil insulating liquid — recommended by IEEE C57.106 and IEC 60422:2013 guides — is to collect an oil sample annually and perform Karl Fischer titration to measure WCO, the water concentration in oil in units of mg/kg.
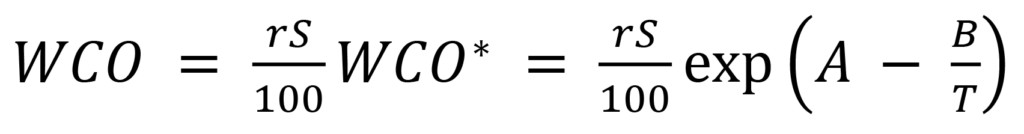
It is considered that relative saturation rS of water in oil is closely related to WCP. Commonly, rS is calculated as a percentage: (1)
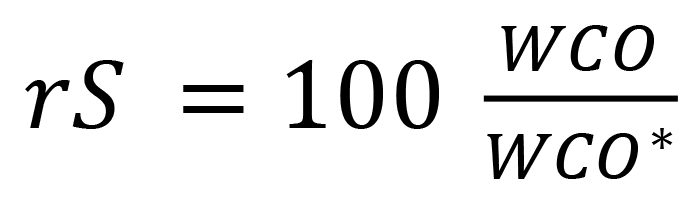
Here, WCO* is the saturation concentration of water in oil at Kelvin temperature T, which is in turn calculated by means of a well-known formula. Recall that Kelvin temperature is equal to Celsius temperature plus 273.15. (2)
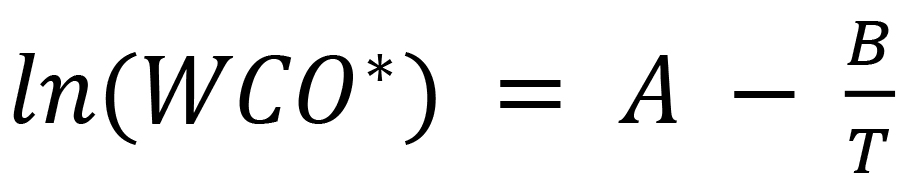
In this formula, A and B are experimentally determined coefficients, and T is the Kelvin temperature of the oil. For a common type of new oil, A = 17.08 and B = 3876. From the formula (2), it is evident that the solubility of water in oil increases as T increases. For example, as T increases from 293 K (20° C) to 320 K (46° C), the water saturation concentration WCO* in new oil triples from 47 to 141 mg/kg. Correspondingly, if the transformer oil contains 28 mg/kg of water and the oil temperature decreases rapidly from 320 K to 293 K, rS triples from 20% to 60%.
Unfortunately, in many cases, the WCO measurements (and rS calculated from them) are found to be highly variable from one oil sample to the next and hard to interpret. The IEEE and IEC guides mentioned previously provide water concentration limits of 15 to 35 mg/kg for service-aged oil, depending on the kV rating of the transformer, but because of high or irregular variability, it is difficult to use them for understanding the wetness of a transformer.
There is another problem. It is a bad idea to use the new-oil solubility coefficients for calculating rS in service-aged oil because the result is likely to be wrong. For example, the water solubility WCO* in a 20-year-old transformer could be twice as much as for new oil. In that case, rS calculated using new-oil coefficients would be twice as high as the actual relative saturation in the aged oil. It is not practical to do a laboratory determination of the solubility coefficients A and B for every transformer every year, so the poor estimate of rS calculated from Karl Fischer WCO and new-oil coefficients is nevertheless often used.
Alternatively, as is often the case with online monitoring, rS can be measured directly and then used to calculate:
 (3)
(3)
which follows from (1) and (2). In this case, WCO* at the point of sampling must be known, which usually means that the sampling point temperature T must be measured along with rS, and the oil’s solubility coefficients A and B also must be known. Unfortunately, some commercially available monitors do not measure T at the sampling point, but calculate WCO from rS at the sampling location with some different temperature using new-oil solubility coefficients.
The relative saturation of water changes in response to changes in oil temperature and WCO, which also varies with temperature. Variation of WCO with temperature depends on oil circulation, winding geometry, and many other factors, and is ultimately governed by the kinematics of water adsorption and desorption by the paper insulation. Curves relating WCP to rS or WCO at thermodynamic equilibrium have been published, for example by Oommen (Figure 2), but those curves are not directly useful for moisture assessment in operating transformers, which never reach thermodynamic moisture equilibrium due to load variation, changes in environmental temperature, and temperature gradients within the transformer. Thus, obtaining reasonable estimates of WCP from rS or WCO for tracking wetness of paper and estimating bubble formation temperature is very challenging, especially if the oil is service-aged and rS is calculated from WCO or vice versa using new-oil solubility coefficients.
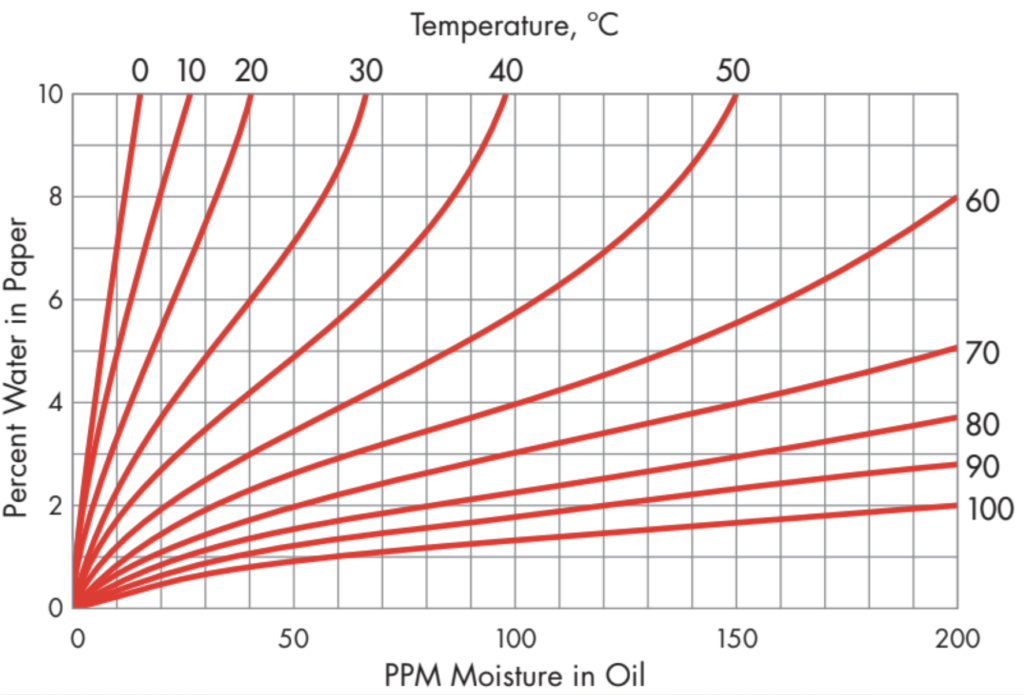
Figure 2: Equilibrium Isotherms of WCP vs. WCO Source: Oommen 2003
As mentioned previously, high rS is undesirable because it reduces the oil’s dielectric breakdown voltage (DBV). One often hears that high rS is dangerous because a temperature drop in the transformer could cause a water emulsion to form in the oil or precipitate liquid water. That is true, but it is an extreme case. A more general reason for concern about high rS in a transformer is seen in Figure 1. In the previous example, the oil temperature rapidly declined from 320 K to 293 K, and rS increased from 20% to 60% (assuming new oil). According to Figure 1, the increase in rS due to that drop in temperature would result in a drop of DBV to about one-third of its starting value. If DBV at the operating temperature is 60 kV, it drops to about 20 kV as a result of the increase in rS. However, if the oil is aged and WCO* is unknown, it is not useful to estimate the change in DBV with rS that is calculated from WCO by assuming that the oil is like new.
In summary, almost all of the “badness” of water in a transformer happens when paper insulation is too moist. Temperature variation that may occur during operation can give rise to water vapor bubbles in the paper or spiking of rS in the oil, either of which reduces DBV and increases the danger of transformer failure. High WCP, together with acids in oxidized oil, can accelerate the degradation of paper insulation. The difficulty of estimating water solubility WCO* in service-aged oil is a major obstacle to accurate transformer moisture assessment. Furthermore, the lack of thermodynamic equilibrium in an operating transformer makes equilibrium charts inappropriate for estimating WCP from rS or WCO.
With online monitoring of rS and T, however, it is possible to estimate WCO*. Comprehensive transformer moisture assessment can then be accomplished by graphically visualizing the dynamics of WCO, rS, and T.
Water Solubility and Oil Quality
Often incorrectly referred to as an Arrhenius formula, the solubility formula (2) is in fact a thermodynamic equation. The water saturation concentration WCO* is a thermodynamic equilibrium constant for the process of water dissolving in oil, and solubility coefficients A and B are proportional to the entropy and the enthalpy of water in oil solution. To see that, recall that the Gibbs energy of any isothermal chemical process is the “useful” energy available for driving the process to equilibrium. It is defined by the equation:
![]() (4)
(4)
where ∆G is the change in Gibbs energy during the reaction, ∆H is the change in enthalpy, ∆S is the change in entropy, and T is the Kelvin temperature at which the process runs. Another thermodynamic equation relates the Gibbs energy of an isothermal chemical process to an equilibrium constant keq at temperature T:
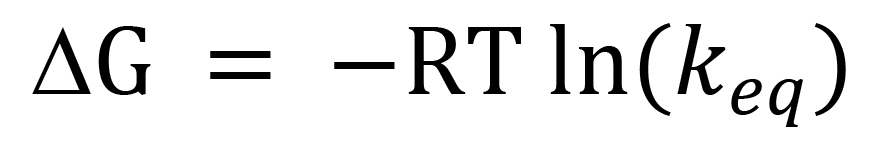 (5)
(5)
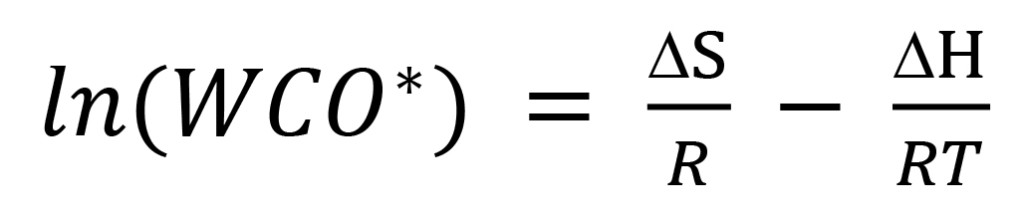
where R is the ideal gas constant 8.3145 J K-1 mol-1. Solving (5) for ln(keq), identifying keq with WCO*, and substituting the right side of (4) for ∆G yields the linear Van ‘t Hoff equation for WCO* with independent variable 1/T:
 (6)
(6)
Comparing (6) with (2), it is clear that solubility coefficient A is the entropy change term ∆S/R, and solubility coefficient B is the enthalpy change coefficient ∆H/R. There is an implicit assumption in (2) and (6) that A and B (i.e., ∆S and ∆H) are the same for all T, which for water dissolution in oil is approximately true over a reasonable range of working temperatures T.
In an operating transformer, there is usually a significant temperature differential between top oil and bottom oil. If rS and T are monitored at the top inlet and the bottom outlet of a radiator as in Figure 3, it is possible to calculate WCO at the top and the bottom by applying formula (3). The oil coming out of the radiator at the bottom has the same water content as the oil going in at the top, so equate WCO calculated for top and bottom:
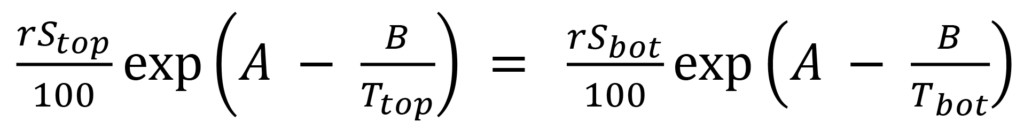 (7)
(7)
Equation (7) can be solved for B:
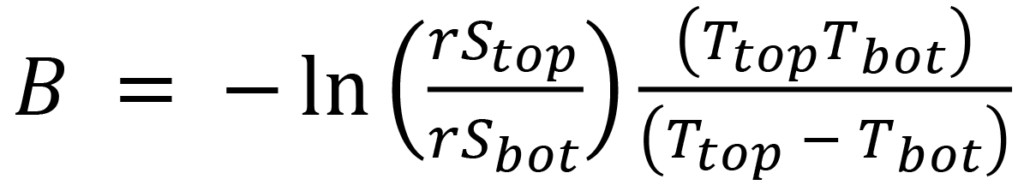 (8)
(8)
Using the data shown in Figure 3, for example:
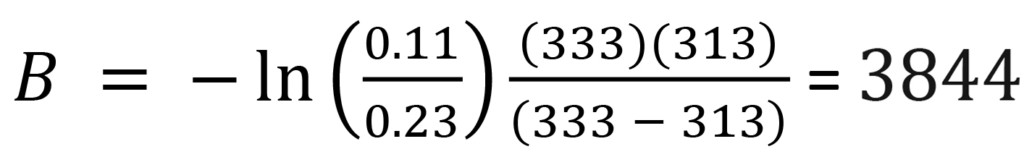 (9)
(9)
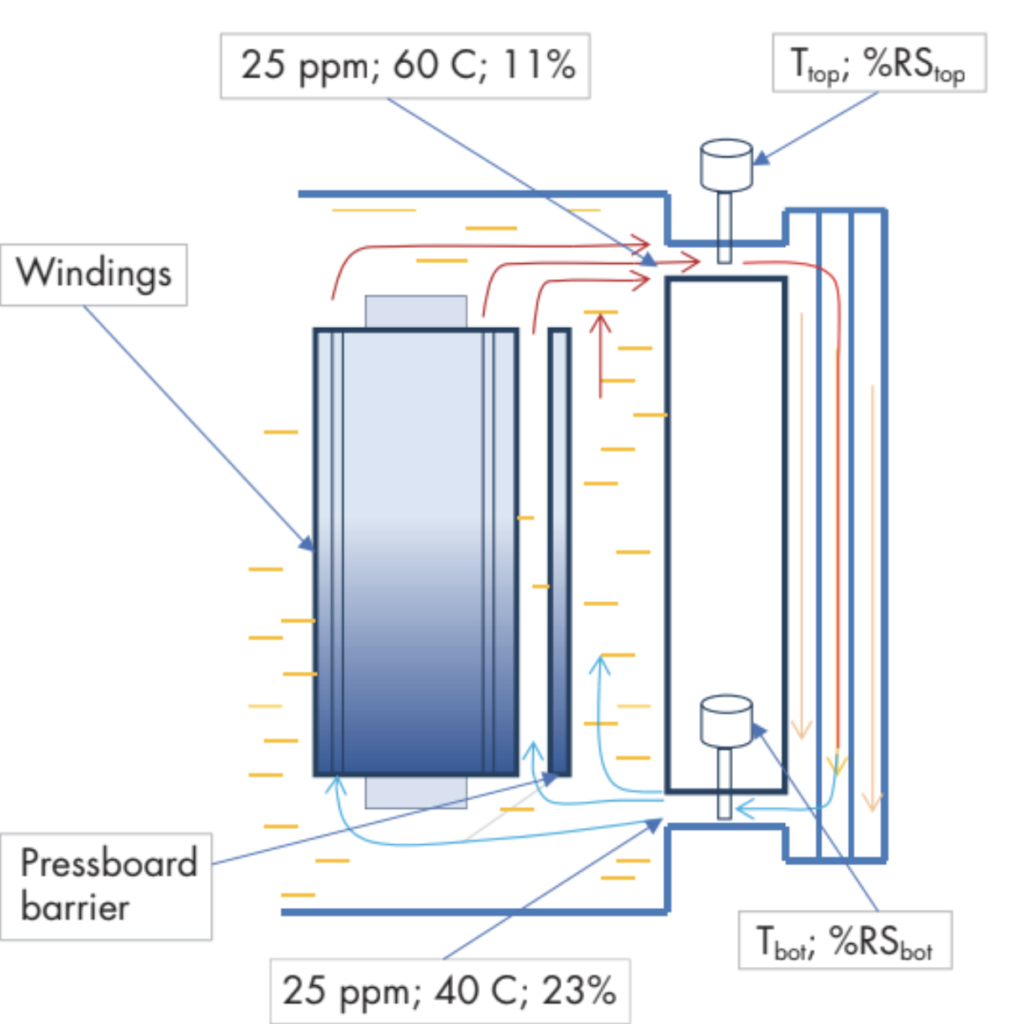
Figure 3: Water Distribution in an Operating Transformer with Moisture Monitoring at Top and Bottom
A moisture assessment of 20 transformers included laboratory determination of solubility coefficients A and B for the oil in each transformer as well as measuring the conventional oil quality parameters such as acid number, interfacial tension, and color. Oil quality results are shown in Table 1. When the points (A, B) for all the studied transformers are plotted on a graph, the regression line:
A = 6.8444 + 0.0026 B (10)
fits the points well, demonstrating a linear relationship between A and B that holds for a range of oil conditions including new oil and severely aged oil. Formulas (8) and (10) jointly represent a practical solution to the problem of determining WCO* for any transformer’s oil based on online moisture monitoring data. To complete the example based on Figure 3, substitute the value of B calculated in (9) into formula (10), obtaining A = 16.84.
Aging of transformer oil consists mainly of slow oxidation creating carbon dioxide and low molecular weight carboxylic acids. The primary chemical indicator of oil aging is the acid number. Water is more soluble in aged oil than in new oil because the carboxylic acid molecules, like water molecules, are polar. Thus, the change in water solubility relative to new oil is also a good indicator of oil aging. Table 1 shows how well the B solubility coefficient is related to oil quality.
Using empirically determined constant values of Bmax = 3900 and Bmin = 3100 representing a realistically wide range of mineral transformer oil conditions from new to severely oxidized, a simple interpolation formula defines an oil quality index (OQI) ranging from 0 (very bad) to 1 (very good), showing where a particular transformer’s oil lies on the oil quality spectrum:
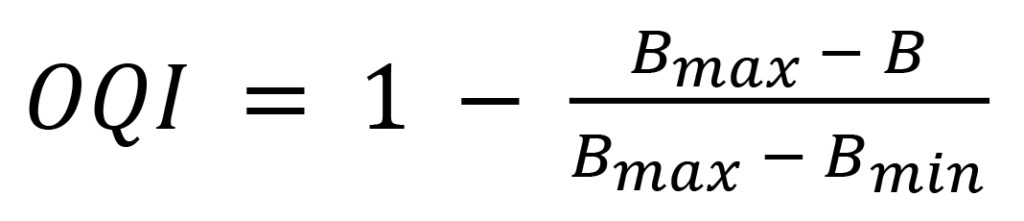 (11)
(11)
OQI values calculated for the example transformers are displayed in Table 1. For the transformer in Figure 3 whose solubility coefficients were calculated above, OQI is 0.93, indicating that the oil is in nearly new condition.
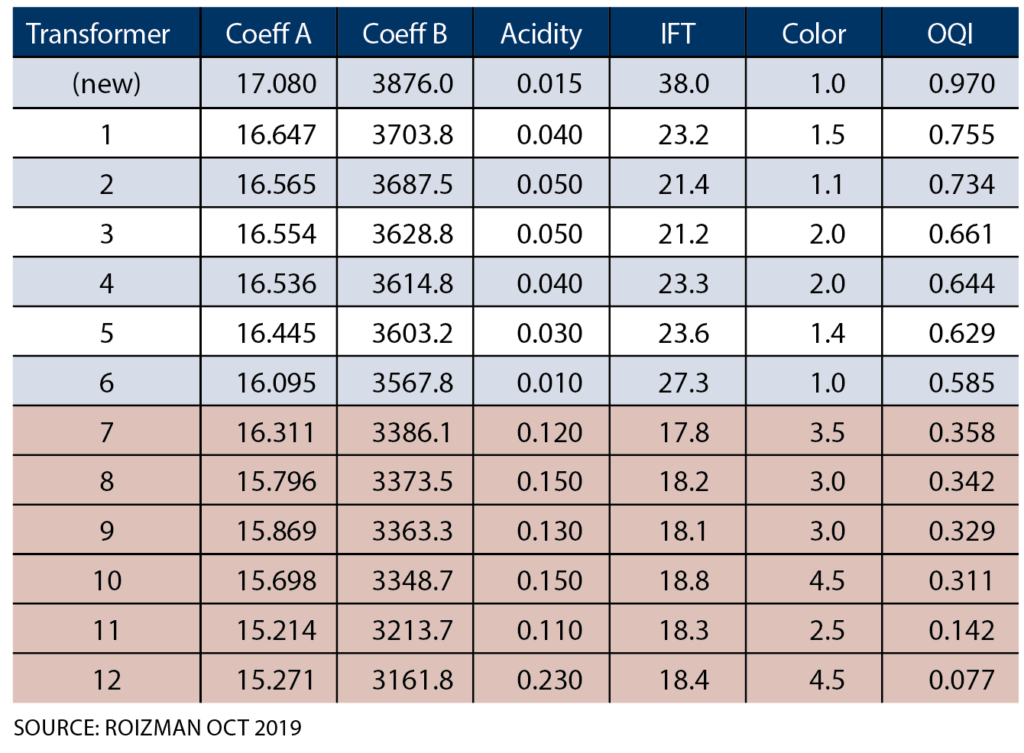
Table 1: Water Solubility and Oil Quality for 12 Transformers
While OQI can be used for ranking transformers according to the apparent condition of their oil, it is especially useful for detecting and assessing a worsening trend in the oil condition of any transformer, such as might occur when the oxidation inhibitor is depleted. This method of assessing relative oil quality is based on completely general principles and can be applied (with suitable choices of Bmax and Bmin) to any insulating liquid, such as natural and synthetic esters, for which deterioration results in the accumulation of polar degradation by-products.
WCO Hysteresis and the Moisture Cloud
It is conventional to plot online monitoring data in time-series format as shown in Figure 4, where it is evident that WCO and T appear to vary together in time. WCO here is calculated from measured rS using the solubility coefficients for this transformer’s oil. A time-series graph for rS would show that rS is also somehow related to T but in a complex way. This time-series view of the transformer’s bottom-oil data does not appear to have much predictive value and is not very helpful for deciding how wet the transformer may be. The amplitude of vertical movement of WCO and rS is obviously limited by WCP. In a very dry transformer, there is not enough water in the oil/paper system to support large temperature-driven variation in WCO or rS. High WCP does not, however, guarantee that the average WCO level will be high. In the case illustrated by Figure 4, WCO was in the below 30 mg/kg IEC “good” range for all but a few hours when WCO spiked to almost 60 mg/kg with a temperature rise. With annual manual sampling, that event almost certainly would have been missed, and the transformer might have avoided notice as possibly being wet.
In Figure 5, the bottom-oil data from Figure 4 is plotted on a WCO versus T chart, and the graph (blue dots) is the superposition of many diurnal loops of various sizes, taking the overall shape of a cloud. The loops illustrate hysteresis in the temperature-driven adsorption and desorption of water from paper insulation. When the transformer is heating up, water comes off the paper into the oil much faster than it can be adsorbed by the paper from the oil when the transformer is cooling down.
The colored background in Figure 5 is derived from the WCO vs. WCP equilibrium isotherms of Figure 2, where WCO is corrected using the solubility coefficients of this transformer’s oil, which are calculated from the moisture monitoring data by means of (8) and (10). The boundaries of the color zones in Figure 5 are contours of equal WCP at thermodynamic equilibrium. The green zone is bounded above by the 1% WCP contour, the yellow zone by the 2% contour, the orange zone by the 3% contour. The red zone includes all WCP levels above 3%. The light-colored zone above red is bounded below by the 100% rS contour, where plotting rS on the WCO vs. T chart also requires use of the oil’s solubility coefficients.
The light-colored rectangle at the lower left marks the zone below 50° C and 20 mg/kg WCO. Due to the very high time constant for water diffusion across thin pressboard under those conditions, the diagnostic significance of the data in this zone is more uncertain.
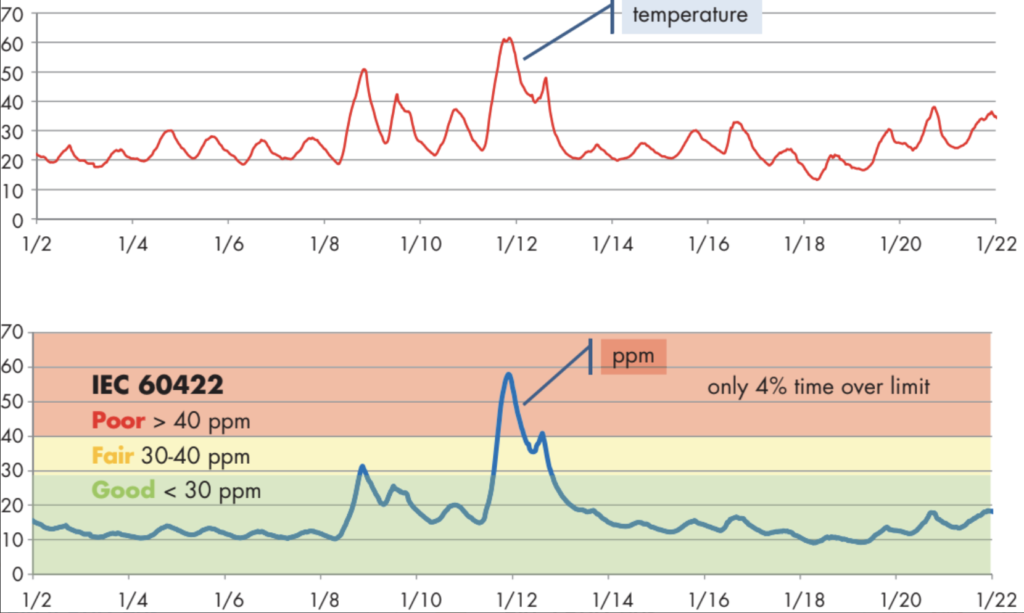
Figure 4: Monitoring Bottom-Oil Temperature and WCO in a Transformer for 3 Weeks
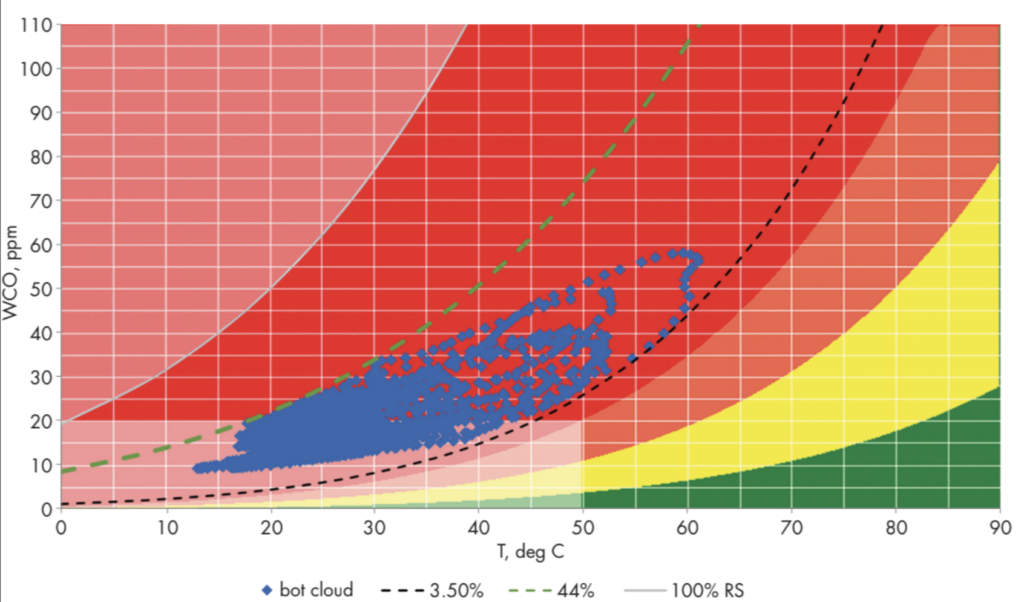
Figure 5: Moisture Cloud Chart
The black dotted curve tangent to the lower part of the cloud is the 3.5% WCP contour, indicating the level of moisture in the paper insulation that is available for exchange with the oil. The maximum rS attained during temperature cycling is indicated by the green dashed curve (see arrow) tangent to the upper part of the cloud, which is the 44% rS contour. That maximum rS value can be related to the DBV vs rS curve (Figure 1) to see that DBV is being severely compromised, going down to about 35% of what it would be in dry oil during the high-rS part of the diurnal temperature cycle.
Offline Moisture Assessment
What can be done for a transformer that doesn’t have online water-in-oil monitoring? The solubility coefficients for the transformer’s oil can be determined for an oil sample by the laboratory, or a rough guess for the solubility coefficients can be made by, for example, comparing the transformer’s latest laboratory oil quality results with Table 1. A rough estimate of the placement of the bottom part of the moisture cloud can be obtained by taking two bottom-oil samples, one at a low oil temperature and the other at a high oil temperature, while the transformer’s temperature is increasing during a single cycle. For both samples, record the temperature T of the sampled oil and get a Karl Fischer determination of WCO. Plot the line on a WCO vs. T chart. Choose several points on that line and use Figure 2 to estimate the equilibrium value of WCP at each point. The highest of those estimates indicates the approximate wetness of the transformer. To assign a color value, use the 1%, 2%, 3% scheme described earlier for defining the color zones on the moisture cloud chart.
Note that one of the samples for offline moisture assessment might need to be collected at a very inconvenient time, such as the middle of the night, to achieve good temperature separation. However, any compromise where either sample is taken when the transformer’s temperature is decreasing or the two samples are not taken during the same temperature cycle is likely to produce a line that does not correctly estimate the wetness of the transformer.
Conclusion
Periodic moisture assessment is highly advisable for power transformers because excessive moisture in oil and paper insulation can accelerate the degradation of the oil and paper and compromise the dielectric strength of the oil by reaching high rS levels during temperature cycling and of the paper by bubble formation in moist paper during sharp temperature rises. Although water accumulates very slowly due to normal paper and oil aging, leaks or other ingress of moist air can lead to an unexpected rapid rise in the transformer’s water content. Early detection of a high level or rate of increase of WCP can prevent trouble or rapid deterioration.
Moisture assessment by comparing annual or semi-annual WCO measurements or rS levels calculated from those measurements with fixed limits is ineffective due to two fundamental problems:
• First, water solubility increases as the oil ages, affecting the direct interpretation of WCO and rS and making the calculation of rS from WCO or vice versa inaccurate.
• Second, for a true understanding of the moisture state of the transformer, it is necessary to take into account the complex temperature-driven dynamics of water exchange between the paper insulation and the oil. Isolated observations are largely uninformative.
A method for determining water solubility in oil from online moisture monitoring data based on the thermodynamics of water solubility in oil provides an oil-quality index and the means to assess the moisture condition of the transformer accurately. Visualizing the cycling of WCO due to temperature variation graphically as a cloud provides a way to assess key moisture parameters such as the wetness of top- and bottom-winding insulation paper, how close the transformer is coming to water saturation in the oil, and whether or not the dielectric breakdown voltage of the oil is being compromised.
References
IEEE Std. C57.106, IEEE Guide for Acceptance and Maintenance of Insulating Mineral Oil in Electrical Equipment, 2015.
International Electrotechnical Commission, IEC 60422, Mineral insulating oils in electrical equipment – Supervision and maintenance guidance, 2013.
ASTM International, ASTM D1533-12, Standard Test Method for Water in Insulating Liquids by Coulometric Karl Fischer Titration, 2012.
International Electrotechnical Commission, IEC 60814, Insulating liquids – Oil-impregnated paper and pressboard – Determination of water by automatic coulometric Karl Fischer titration, Second Edition, 1997.
P. J. Griffin, “Water in Transformers – So What!” National Grid Conference on Condition Monitoring in High-Voltage Substations, Dorling, 1995.
T.V. Oommen. “Moisture Equilibrium Curves — Use and Misuse,” in Proceedings of International Conference of Doble Clients, Boston, 2003.
CIGRE Task Force D1.01.10, Ageing of cellulose in mineral-oil insulated transformers, Technical Brochure 323, October 2007.
CIGRE Working Group A2.30, Moisture equilibrium and moisture migration within transformer insulation systems, Technical Brochure 349, 2008.
O. Roizman and C. Feely, “Continuous Online Oil Quality Monitoring,” in Proceedings of TechCon Asia Pacific, 2016.
O. Roizman, “Water in Transformers: All You Wanted to Know About It But Were Afraid to Ask,” Transformers Magazine, Vol 6, No 1, January 2019.
O. Roizman, “Moisture Equilibrium in Transformer Insulation Systems: Mirage or Reality? Part 2,” Transformers Magazine, Vol 6, No 3, July 2019.
O. Roizman, “How Water Affects Oil Quality and Helps Monitor its Aging,” Transformers Magazine, Vol 6, No 4, Oct 2019.
 Oleg Roizman, PhD, is a founder and Managing Director of Intellpower Pty. Ltd. in Australia, an engineering consulting/services company with emphasis on continuous online monitoring and power transformer diagnostics. Prior to forming IntellPower in 2000, Oleg was employed by Monash University in Australia as an R&D Principal Investigator, where he was involved in developing analytics in the areas of power system stability, power quality, monitoring, and diagnostics of electrical plants. Oleg is an inventor, speaker, author of many technical papers, and an active member of various working groups within IEEE PES Transformers Committee and CIGRE. He received a PhD in electrical and electronics engineering from Novosibirsk State Technical University in Novosibirsk, Russia.
 James J. Dukarm, PhD, is the founder and Principal Scientist of Delta-X Research Inc. in Victoria, BC, Canada. A member of ASTM and CIGRE and a Life Member of IEEE, James has been actively involved in the development and revision of IEEE Transformers Committee DGA guides C57.104, C57.139, and C57.155. He has co-authored several papers in IEEE journals and NETA World and has presented numerous times at industry conferences. James received an MS in mathematics from St. Mary’s University, San Antonio, TX, and a PhD. in mathematics from Simon Fraser University, Burnaby, BC, Canada.