
While the chemistry behind dissolved gas analysis (DGA) is complex and important for industry chemists to understand, the typical DGA review need not be as complex. Thermal or hot metal gasses are commonly known in DGA, and they are widely understood by industry experts, chemists, and many asset owners. The carbon oxide gasses — carbon dioxide and carbon monoxide — have always been a gray area. It is widely accepted that the production of carbon monoxide increases where thermal energy is applied. However, higher levels of carbon monoxide do not always mean issues with paper, and the lack of measured production does not mean there are no paper-related issues with the transformer.
Some time ago, I taught a small seminar for Memphis Light, Gas and Water. The topics for the day were power factor testing and DGA. Chris Rutledge, a young man who worked in the transformer repair shop at MLGW, attended that day, and he asked about the carbon oxide gasses. I responded, “These are likely the least understood gasses by the industry.” To my understanding at the time, if you had any paper issues with a transformer, carbon monoxide would be produced — and that was the extent of my knowledge related to these gasses.
At the end of the seminar, I provided my email and phone number, and Chris began to reach out; we developed a close relationship over the years. After Chris took over as supervisor of the transformer repair shop in late 2013 or early 2014, Chris believed he had found a way to categorize paper vs. bare-metal faults in transformers. He asked me to look over his findings to see if I could come to the same conclusions. From that moment to today, life has not been the same. I was amazed at how simple it was to do and quite surprised that it had not been noticed before in the industry.
This article identifies these relatively recent and simple steps to interpret DGA that can be applied to identify what is involved in a transformer fault. These interpretation steps simplify the analytics regarding what many consider to be a very complex subject: categorizing developing internal faults for oil-filled power transformers. Obtaining these answers — initially, we need to know the amount of paper involved in a given fault — can mean the difference between less costly, onsite repair versus total replacement of the transformer. In rarer cases where we struggle to make sense of the information, a number of industry chemists and experts are willing to assist with a deeper interpretation. Most end users look for acetylene and feel better when they do not see it in a DGA, and rightfully so. However, if this is the extent of your knowledge and you want an improved grasp of what can be a very stressful topic, continue reading.
The Facts
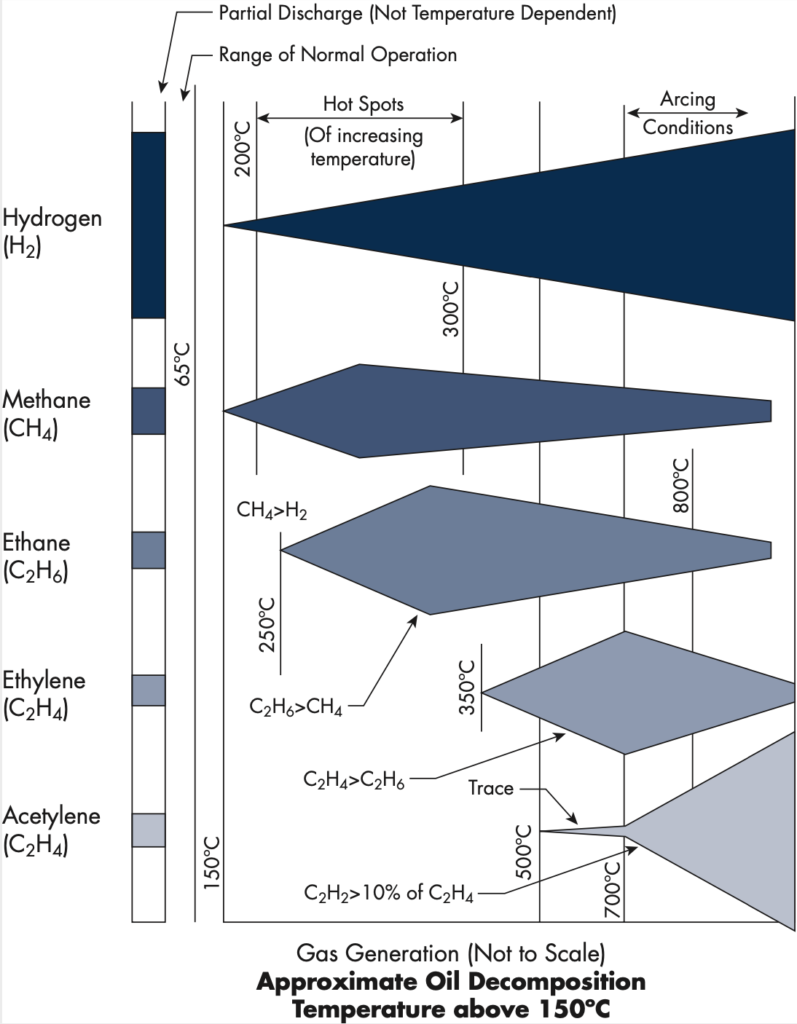
Figure 1: Combustible Gas Generation vs. Temperature
There are knowns in DGA. The industry is proficient at identifying overheating (thermal faults) in oil-filled power transformers, and the novice has access to a wealth of tools. Measuring the internal oil temperature at 150°C+ temperatures is accomplished by measuring the hot metal gasses. These gasses are, in order of their initial thermal generation, hydrogen (H₂), methane (CH₄), ethane (C₂H₆), ethylene (C₂H₄), and acetylene (C₂H2).
The diagnosis of paper via the carbon oxide gasses — carbon dioxide (CO₂) and carbon monoxide (CO) — is not quite as well understood. It can be even more challenging if the trouble exists on a paper-wrapped lead, since that scenario involves significantly less paper.
According to a CIGRE study (Figure 2), if you exclude bushing failures where faults are typically detected either by off-line power factor/dissipation factor testing or on-line capacitance delta monitoring, the three main categories of failure are windings, tap changers, and lead exits. To simplify the process, think of interpreting the gasses like putting together a three-piece puzzle — winding, leads, and connections — in other words, a great deal of paper, some paper, or no paper. This process simplifies the findings and allows the technician to properly categorize the ongoing fault or conduct post-fault analysis.
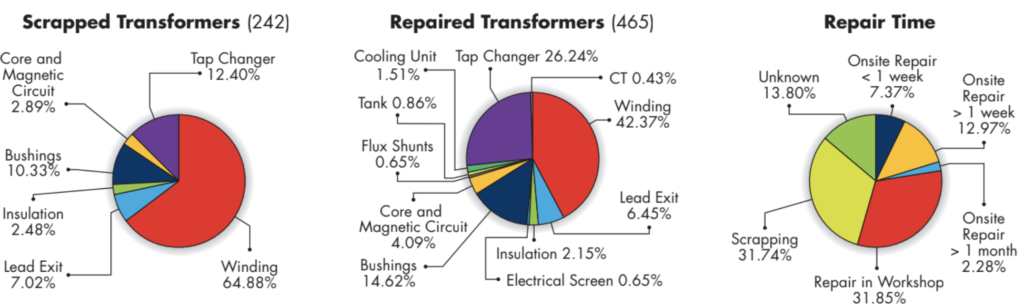
Figure 2: CIGRE Study on Causes of Failure in Scrapped vs. Repaired Transformers
Our focus for interpreting legacy transformer DGA would be better served by concentrating on these areas, which tend to be more common failure modes. What do we really want to know when reviewing DGA? Shouldn’t it be the amount of paper involved in a developing fault, if any? After all, the initial question we want to answer if a problem arises is “Can it be repaired onsite, and if so, is it a bare metal connection, a paper-wrapped lead, or a winding?”
To better understand how to arrive at a conclusion regarding any developing issue, it is important to note that at all working temperatures, CO is less soluble than CO₂ (Figure 3).
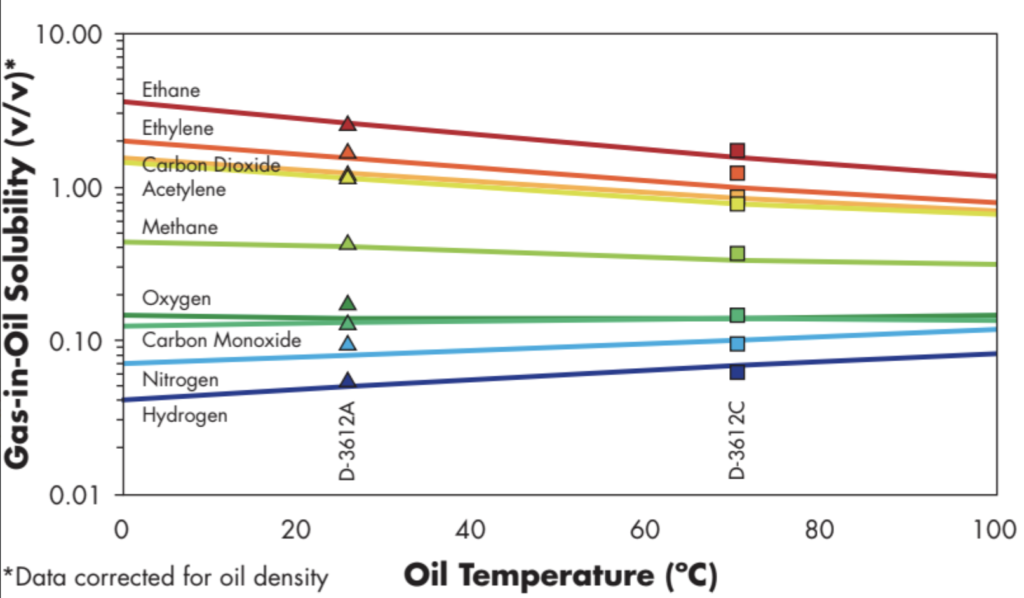
Figure 3: Gas Solubility Coefficients in Oil
This is an important point, since to identify categorically where a problem exists, the CO₂/CO ratio must be trended as opposed to a snapshot in time. In other words, what was the ratio prior to the problem and where is its norm? This thinking is new to our industry, as this ratio is typically referred to in many technical publications and industry guides as a single value for diagnostic purposes. To demonstrate this more fully, the following transformers both tripped on a transformer differential relay operation with a very similar arcing profile. There’s no question that a flashover occurred in both transformers as seen in (Figure 4).
However, these transformers had very different outcomes, evidenced by the post-event impact on the CO₂/CO ratio (Figure 5).
We now know that the more paper involved in a fault, the greater the impact on the CO2/CO ratio, as shown in Figure 6a and Figure 6b, which demonstrate the results of the aforementioned transformer trips. Where the ratio dropped significantly, a low-side winding failure occurred; where a paper-wrapped primary lead flashed over (minimal paper), there was much less impact.
To further illustrate the value of this ratio, the 10 MVA transformer in Table 1 tripped on a transformer differential relay operation. There was absolutely no impact on the CO₂/CO ratio, verifying that no paper was involved in the presence of the hot metal gas generated post-fault.
As seen in Table 1, the hot metal gas did not have a negative impact on the CO₂/CO ratio. Internal inspection revealed a failed, de-energized high-side tap changer. No paper was involved in the fault, so when the ratio was compared to generation of hot metal gas at the time of the trip, the lack of impact tells the story: No paper was involved, thus the issue was a bare-metal connection such as a de-energized tap changer contact. In many if not most cases, an onsite repair can be made. This is an important point since onsite repair is typically less time consuming and less costly than replacement.
Testing the Theory
To better understand the effect thermal energy has on the CO₂/CO ratio, Memphis Light, Gas and Water conducted an experiment on a 25 KVA transformer with mineral oil and Kraft paper. A thermal well was installed through the wall of the transformer and inserted to a depth of 5 in. into the windings. A small heating element was placed into the well and raised to temperatures ranging from 100°C to 180°C over a period of 22 days. The results of this experiment are shown in Figure 7. The CO₂/CO ratio started at 55.60:1 at 100°C; as the temperature increased in 10-degree increments, the ratio displayed a steady increase until 150°C was reached. At this point, the ratio was at 78.51:1, but it began to decrease as the temperature continued to be raised up to 180°C. The ratio had declined to 48.23:1, and at this point, the heating element was moved so that it was no longer in contact with the paper insulation and was only directly heating the oil. The temperature of the heating element was maintained at 180°C. After the element was positioned to only be in direct contact with the oil, the CO₂/CO ratio began to steadily rise, apart from the 11/21/2014 sample, until it reached 52.55:1 at the end of the experiment. The 11/21/2014 sample was determined to be erroneous due to all gas levels being approximately half the value of the samples taken immediately before and after that date.
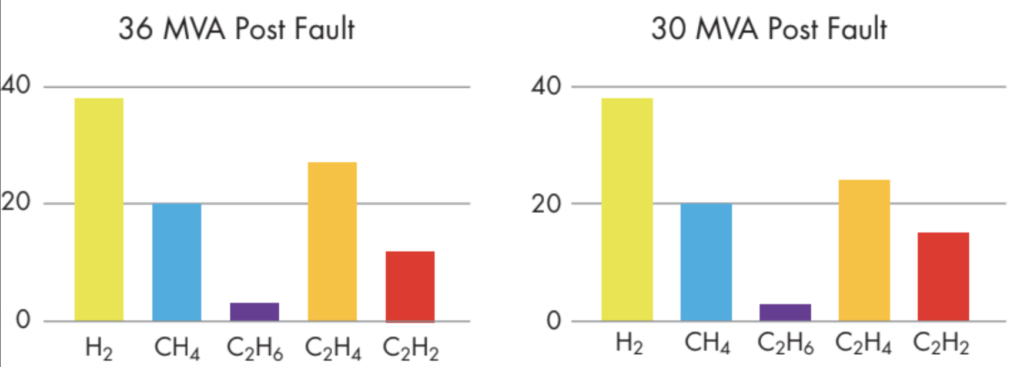
Figure 4: Gas Ratios Following Flashover
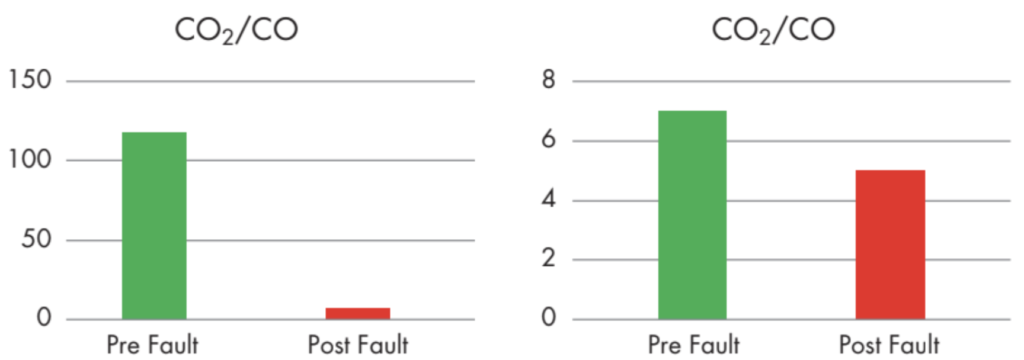
Figure 5: Post-Event Impact on CO₂/CO Ratio
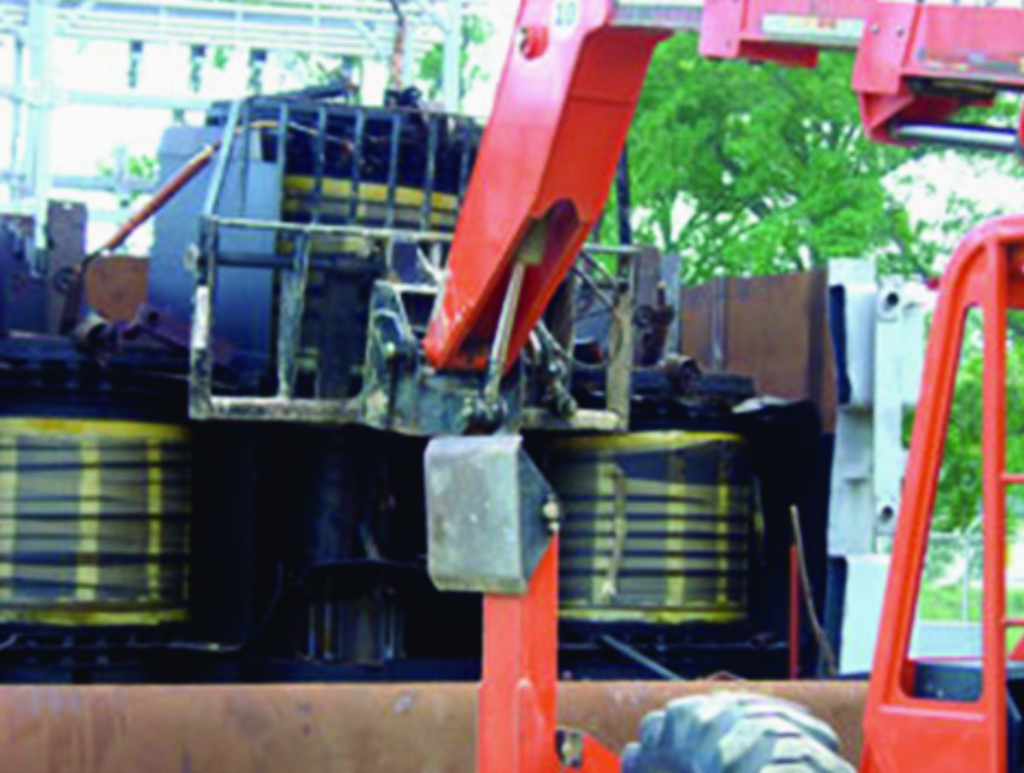
Figure 6a: Low-Side Winding
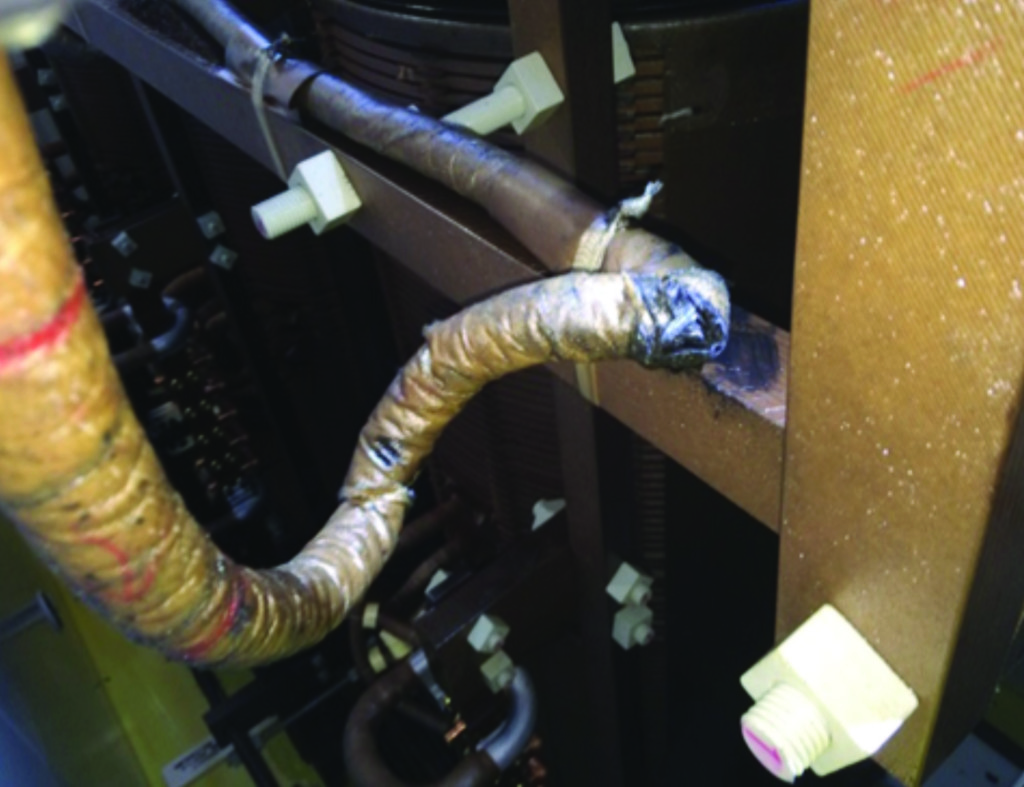
Figure 6b: Paper-Wrapped Primary Lead
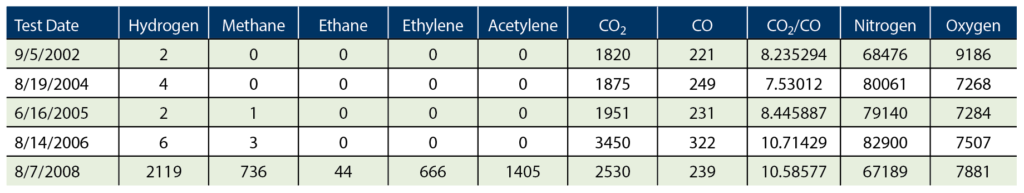
Table 1: Impact on CO₂/CO Ratio
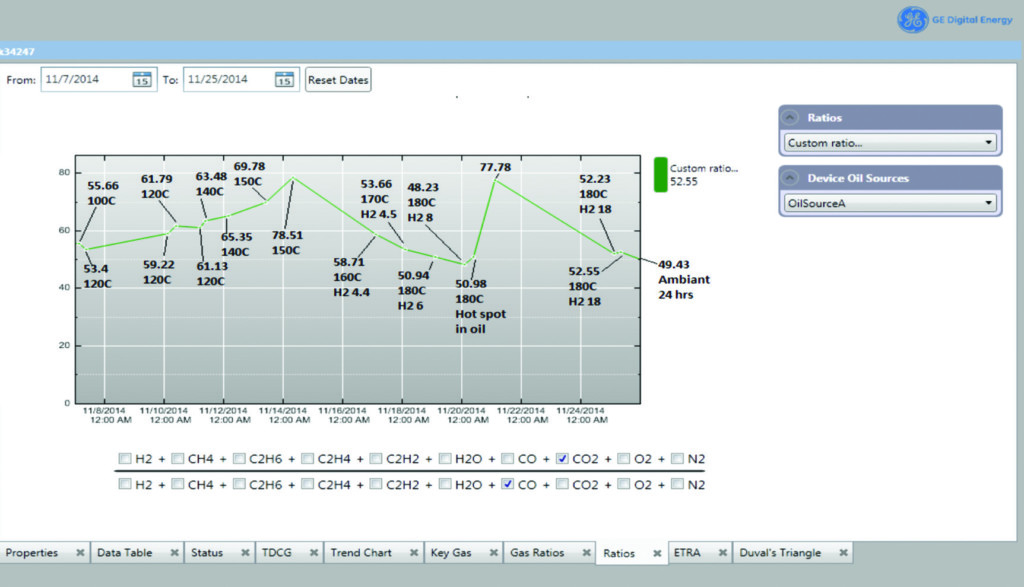
Figure 7: Effects of Thermal Energy on CO₂/CO Ratio Source: Rutledge
Why Does It Work?
CO will never remain dissolved in oil equal to or more than CO2. The CO₂/CO ratio cannot drop in the absence of CO creation because CO seeks to leave solution at all working temperatures relative to CO₂. Therefore, if both gasses are decreasing relative to prior samples and the ratio drops, it must be because CO is being generated more than CO₂; however, both are being generated at lower levels than are leaving the oil. Looking at the design of a transformer, we can better understand why the ratio of CO₂ and CO can be used to identify the general fault location. In other words, does the problem include heavy paper involvement, light paper involvement, or no paper involvement? The relative availability of oil to contact the paper determines the available O₂. The more oil available, the more cooling and O₂ is available. In the windings, where paper is tightly wrapped, oil has less contact per volume of paper than on a lead.
Conclusion
Transformers have a home as it relates to the CO₂/CO ratio. Additionally, these ratios are not all the same. Some publications note the ratio should be between 3:1 and 11:1, while other publications say it should be above 7:1. The truth is that transformers can, for the most part, be just about any value. The key is not what value they display when all is well, but rather what happens to these values when issues develop proportional to their norm. We have learned that where paper is heavily involved (e.g. inner winding), the ratio drops a minimum amount of 65%. Where less paper is involved such as a paper-wrapped lead or even an outer winding where there is greater access to available O₂, the value drops between 25% and 50%. Where no paper is involved, the ratio may actually increase, or it may decrease slightly.
References
CIGRÉ A2.37. “Transformer Reliability Survey.”
Molla Morshad. “Transformer Oil Analysis,” accessed at https://www.slideshare.net/MollaMorshad/transformer-oilspecifications-new/55.
Rutledge, Chris. “Dissolved Gas Analysis Using Carbon Oxide Ratios,” TechCon 2016.
 Randy Cox is the Domain Expertise Manager for GE Grid Solutions. His current duties include interfacing with the industry, writing and presenting industry technical papers, committee work, and customer education. Prior to GE Grid Solutions, Randy was employed by SPX Transformer Solutions, Inc. as the Operations Supervisor for the Texas Service Center, which included staffing and implementing a new service center to perform transformer installations, repair, and LTC maintenance. He also worked for Oncor Electric Delivery’s Dallas District as the Diagnostic Technician Operations Supervisor for 29 years and served as the Transmission Chairperson for Oncor’s Oil & SF6 Diagnostics and Diagnostic Testing Training committees. Randy has published many industry technical papers related to substation transformer and circuit breaker diagnostics. He is an IEEE member and a Fellow at General Electric.