
Power factor measurement has long been accepted as an invaluable tool for identifying insulation defects such as aging, deterioration, moisture ingress, and localized failures involving the winding and bushing insulation of a power transformer. Historically, power factor measurements have been performed at a single test frequency (typically 60Hz) and at a single test voltage (typically 10kV). However, modern test instruments can perform power factor measurements at several different test frequencies and at several different test voltages with minimal additional time and effort.
Based on experience, performing power factor frequency sweep and voltage sweep measurements can help identify and confirm:
- Compromised insulation
- User error
- Influence of the test environment
Power factor sweep measurements help the industry:
- Better assess the condition of an insulation system
- Determine whether a given power factor measurement is even valid
Power factor measurement is highly sensitive to the test environment — for example, it is sensitive to moisture on the surfaces of the bushings during the time of the test, to the test connections, and to the test specimen’s earth-ground connection — so a simple tool that allows a user to better detect a bad power factor measurement is useful.
Although power factor sweep measurements can be performed on the overall winding insulation of a power transformer, this paper focuses on the benefits of applying sweep measurements to the C1 insulation of bushings. While power factor sweep measurements are not the silver bullet of power factor testing, they can be beneficial for the maintenance testing industry.
Who Can Benefit from Performing Power factor Sweep Measurements?
Power factor measurement is highly sensitive. Therefore, obtaining correct (i.e., valid) power factor measurements in the field is challenging. In many cases, a questionable power factor measurement is not caused by compromised insulation, but is due to either user error or the influence of the test environment.
Unfortunately, an invalid measurement is often not identified until the user leaves the job site, places the transformer back into service, and returns to the office. The user often has only a short window of time to test a power transformer — only one shot to obtain the correct measurements.
The Test Equipment Operator
Invalid power factor measurements that go undetected are a significant waste of a company’s resources. Although it is difficult for the user to determine whether a power factor measurement at one test voltage and one test frequency is valid, invalid measurements often become obvious when the power factor sweep measurements are performed and analyzed. Therefore, the test equipment operator should use power factor sweep measurements as a tool to quickly identify and correct invalid or questionable measurements before they leave the job site with incorrect test results.
The Engineer
In most cases, a test equipment operator performs power factor measurements in the field and distributes a test report to an engineer, who assesses the test results in the office. Based on the results, the engineer is responsible for assessing the condition of the insulation system to determine the appropriate course of action.
A disconnect often exists between the test equipment operator and the engineer. In most cases, the engineer is not on site when the measurements are performed, making it difficult to be confident that the measurements are valid. However, an engineer who has the power factor sweep results in hand can better identify invalid measurements, which helps prevent an incorrect condition assessment.
It is widely known that the best way to assess a power factor measurement is to compare the most recent measurement to a series of previous baseline measurements that were obtained at consistent test intervals. However, many asset owners do not have a collection of reliable baseline test results for their transformer fleet, which makes assessing the condition of an insulation system and determining the appropriate course of action a challenge. Fortunately, power factor sweep measurements can be used to better assess the condition of an insulation system at a given point in time, especially when there are no historical test results for comparison.
Power Factor Sweep Test Analysis
Analysis of voltage sweep and frequency sweep measurements is performed visually. The power factor measurements are plotted versus the applied test voltage and versus the applied test frequency, and the condition of the insulation is assessed based on the shape of the plots (aka, the traces). Although this paper focuses on applying power factor sweep measurements to the C1 insulation system of bushings, the same analysis strategies are valid for assessing power factor sweep measurements performed on the overall winding insulation of a power transformer. In general, the analysis involves determining whether the shape of a trace is normal or abnormal. If either of the sweep measurements produces an abnormal trace, the insulation system should be investigated and/or tested more frequently in the future.
Power Factor Voltage Sweep Test (aka Voltage Tip-Up Test)
Performing a power factor measurement at multiple test voltages helps identify compromised insulation as well as invalid power factor measurements. At a minimum, an oil-and-paper insulation system should be tested at two test voltages (e.g., 2kV and 10kV). In most cases, a power factor measurement performed on bushing insulation should not be voltage sensitive. Therefore, regardless of the applied test voltage, the measured power factor value should be the same.
If the measured power factor value is not reasonably similar compared to the same power factor measurement at a different voltage, the measurement is questionable and should be investigated. To investigate further, the power factor measurement can be repeated at four or five different test voltages (e.g., 2kV, 4kV, 6kV, 8kV, and 10kV) to establish a definitive pattern.
When a power factor measurement is invalid, it often becomes voltage sensitive. Therefore, a power factor measurement at two different test voltages — first at a relatively low test voltage (e.g., 1kV or 2kV) and then at a relatively high test voltage (e.g., 10kV) — can detect invalid measurements better than a single power factor measurement at one test voltage.
When the insulation of a bushing begins to deteriorate, the C1 power factor measurement for that bushing often becomes voltage sensitive. Therefore, at a minimum, a bushing C1 power factor measurement should be performed at two different test voltages (e.g., 2kV and 10kV). If the power factor value obtained at the two test voltages is not reasonably similar, then the C1 insulation of the bushing is typically deemed questionable. Remember, however, that a few bushing types may produce C1 power factor measurements that are slightly voltage sensitive even when the C1 insulation system of the bushing is healthy.
The Power Factor Frequency Sweep Test
Performing a power factor measurement at multiple test frequencies helps to identify compromised insulation and invalid measurements. The power factor frequency sweep test involves performing power factor measurements at a series of various test frequencies (e.g., 15Hz, 30Hz, 45Hz, 60Hz, 150Hz, 200Hz, 300Hz, and 400Hz).
The general guidelines used to assess a frequency sweep trace (Figure 1) are as follows:
- In general, if an oil-and-paper insulation system is healthy, the measured power factor value increases versus frequency. In other words, the frequency sweep trace climbs uphill versus frequency.
- As an oil-and-paper insulation system deteriorates, the frequency sweep trace typically becomes flat, or worse, decreases versus frequency. If the trace decreases versus frequency throughout all or most of the frequency sweep, then the insulation system is typically considered questionable and is either investigated further and/or tested more frequently in the future.
- Another characteristic of compromised insulation is a distinct fishhook shape in the lower frequency range of the sweep (i.e., at frequencies below 60Hz). If this occurs, the insulation system is typically considered questionable and is investigated further and/or tested more frequently in the future.
- One advantage of performing power factor frequency sweep measurements on the C1 insulation system of a bushing is that, in most cases, a bushing mounted on a power transformer has two or three similar-unit bushings that can be tested and compared to each other. In general, power factor sweep measurements should behave similarly when comparing similar-unit bushings. Ideally, the traces for similar-unit bushings overlay or overlap when plotted against each other. Most important, the shape of the frequency sweep traces should be reasonably similar when comparing similar-unit bushings. If the shape of the trace of one bushing is dissimilar relative to the shape of the traces of the other similar-unit bushings, then the dissimilar bushing should be investigated further and/or tested more frequently in the future.
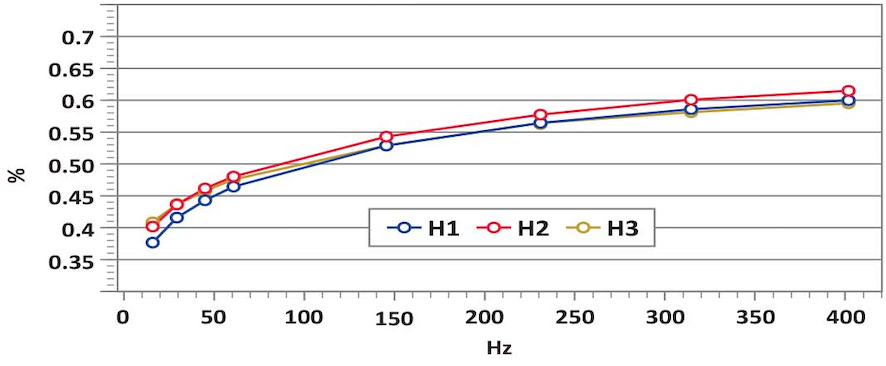
Figure 1: Acceptable C1 Power Factor Frequency Sweep Traces
The C1 power factor frequency sweep measurements for three sister-unit bushings are provided in Figure 1. Notice that the shape of the traces is similar when comparing the similar-unit bushings, and in all the traces in Figure 1, the measured power factor increases versus frequency (from left-to-right). This is typically indicative of healthy insulation.
Case Studies
Several case studies involving power factor sweep measurements helped identify both compromised insulation and invalid measurements and demonstrated the value of performing power factor sweep tests on the C1 insulation of a bushing.
Case Study #1: Haefely 115kV Bushings
The first case involves power factor measurements that were performed on three Haefely 115kV bushings (Figure 2).
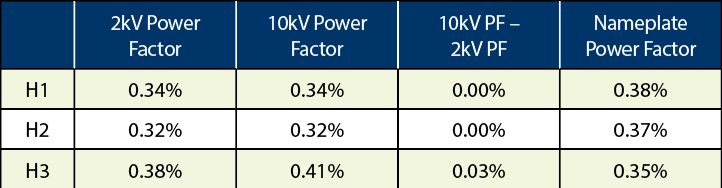
HAEFELY 115kV Bushings (2000)
*Note: the measured capacitance for each bushing compared well to its respective nameplate value.
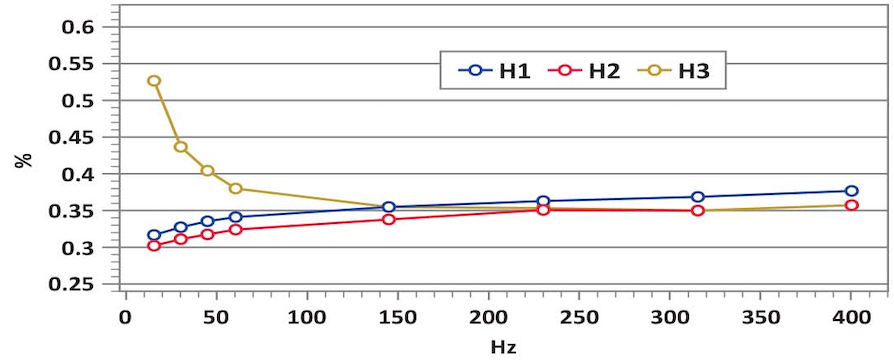
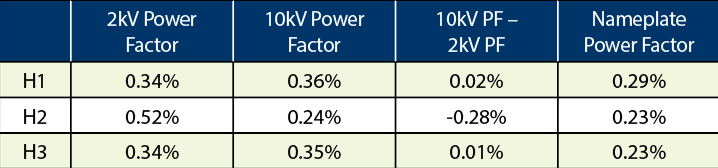
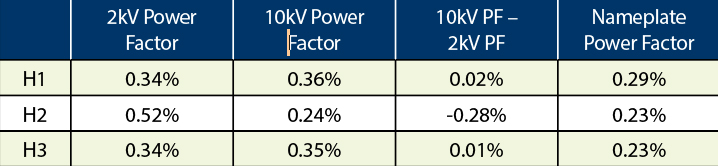
Figure 2: C1 Power Factor Results for Three Haefely 115kV Bushings
Based on the results in Figure 2, the 10kV power factor for H3 is higher than its nameplate value, whereas the 10kV power factor for the other two bushings is below their respective nameplate values. Notice that the 2kV and 10kV power factor measurements for the H3 bushing are dissimilar. In contrast, the 2kV and 10kV power factor measurements for the H1 and H2 bushings are reasonably similar, which further suggests that the H3 measurements are abnormal.
When comparing the power factor frequency sweep traces among similar-unit bushings, the shape of the traces should be reasonably similar. Clearly, the shape of the H3 trace is dissimilar relative to the traces of the other two bushings. Moreover, the H3 trace decreases versus frequency and has the distinctive fish-hook in the lower frequency range; this is typically indicative of compromised insulation.
Interestingly, the 10kV power factor for H3 is below 1.5 to 2 times its nameplate value, which the industry generally considers to be acceptable. However, the H3 bushing is clearly behaving differently than the other two similar bushings, which is cause for concern. This case demonstrates that power factor sweep measurements are more sensitive to compromised insulation than conventional 10kV power factor measurements. The H3 bushing should be flagged as the weak link among the three bushings, and if returned to service, should be tested more frequently to gauge the severity of the situation.
Case Study #2: Lapp POC Series 2 115kV Bushings
The second case involves power factor measurements performed on three Lapp POC Series 2 115kV bushings (Figure 3).
Lapp POC Series 2 115kV Bushings
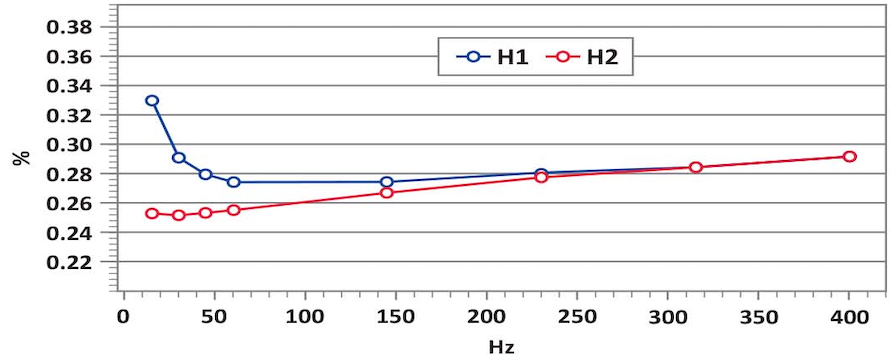
Figure 3: C1 Power Factor Results for Lapp POC Series 2 115kV Bushings
The power factor frequency sweep trace for the H3 bushing is not plotted because its 10kV power factor value is three times its nameplate value, which is already enough to condemn the H3 bushing. In other words, the power factor frequency sweep trace for the H3 bushing only confirms what we already know. Additionally, the 2kV and 10kV power factor values for the H3 bushing differ significantly — further evidence to condemn the H3 bushing.
Based on the results in Figure 3, the 10kV power factor value for H1 is higher than its nameplate value, whereas the 10kV power factor value for the H2 bushing is the same as its nameplate value. Additionally, the frequency sweep trace for the H1 bushing is clearly dissimilar relative to the frequency sweep trace for the H2 bushing. The H1 trace decreases versus frequency and has developed the distinctive fish-hook in the low-frequency range — typically indicative of compromised insulation. Although the 10kV power factor for H1 is well below 1.5 to 2 times its nameplate value, the H1 bushing is clearly behaving differently than the H2 bushing. As a result, the H1 bushing should be tested more frequently to gauge the severity of the situation.
Case Study #3: Westinghouse Electric Type S 37kV Bushings
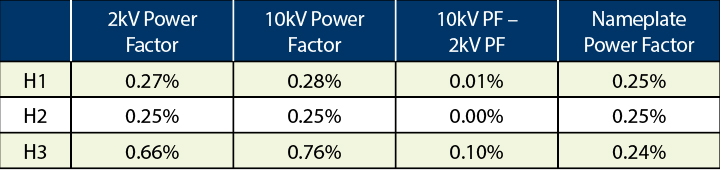
The third case involves power factor measurements performed on three Westinghouse Electric Type-S 37kV bushings. The power factor measurements are summarized in Figure 4.
Westinghouse Electric Type S 37kV Bushings
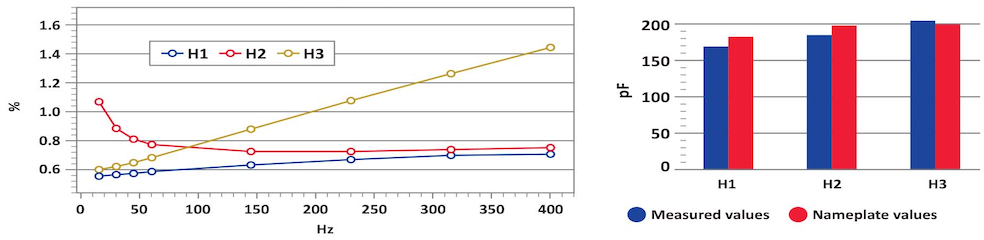
Figure 4: C1 Power Factor Results for Three Westinghouse Type-S 37kV Bushings
This case provides an example of three sister-unit bushings that produced three completely different power factor frequency sweep traces. The power factor frequency sweep trace for the H1 bushing is a typical example of a trace produced by a healthy bushing, whereas the power factor frequency sweep trace for the H2 bushing is a typical example of a trace produced by a questionable bushing. However, the power factor frequency sweep trace for the H3 bushing is an example of an abnormal or non-typical frequency sweep trace, which warrants concern.
Based on experience, there appears to be a bushing insulation failure mode where the measured capacitance (pF) value of the bushing is dissimilar relative to its nameplate value and to the other sister-unit bushings. For this type of insulation failure, in addition to the measured capacitance (pF) value being different than expected, the power factor frequency sweep trace becomes more-or-less linear and exhibits a steep incline from left-to-right (as demonstrated by the H3 bushing in Figure 4).
Interestingly, the H1 and H2 bushings tested with capacitance (PF) values well below their respective nameplate values; the capacitance value of the H3 bushing is above its nameplate value. If the measurements provided in Figure 4 can be verified, the insulation system of the H3 bushing is suspect, and if returned to service, should be tested more frequently to gauge the severity of the situation.
Case Study #4: Lapp POC 138kV Bushings
This case involves power factor measurements performed on three Lapp POC 138kV bushings (Figure 5).
Lapp POC 138kV Bushings
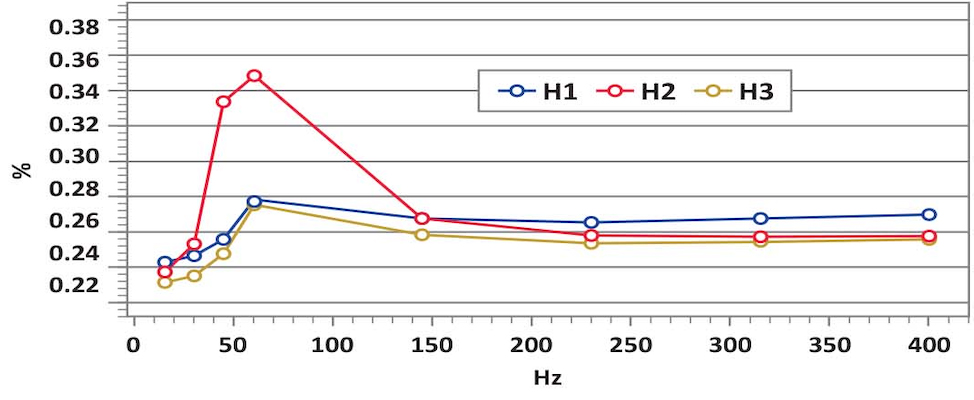
Figure 5: C1 Power Factor Results for Three Lapp POC 138kV Bushings
Based on the results in Figure 5, the power factor values for all three bushings are higher than their respective nameplate values. Notice that the power factor measurement for the H2 bushing is clearly voltage sensitive. Furthermore, the power factor frequency sweep traces for the three bushings are erratic and jagged. In general, jagged power factor frequency sweep traces are indicative of invalid power factor measurements. Regardless of whether an insulation system is healthy or compromised, its power factor frequency sweep trace should be smooth.
By analyzing only the 10kV power factor measurements, it is not obvious that the power factor measurements for the three bushings are invalid; however, the voltage and frequency sweep test results make it obvious that the power factor measurements are invalid. In this case, the customer determined that the primary-side bushing terminals were not short-circuited together when the C1 power factor measurements were performed; this identified the cause of the abnormal power factor measurements.
Conclusion
With both the voltage and frequency sweep measurements on hand, invalid measurements are easier to identify. The equipment operator can use the sweep measurements to quickly identify and correct invalid measurements in the field before the transformer is placed back into service. The engineer can use the sweep measurements to identify invalid power factor measurements, especially when they must rely on the data provided within a test report.
Finally, power factor sweep measurements help to accurately assess the condition of a bushing’s insulation system. This helps the engineer choose the best course of action.
References
IEEE Std. C57.152-2013, IEEE Guide for Diagnostic Field Testing of Fluid-Filled Power Transformers, Regulators, and Reactors.
 Brandon Dupuis joined OMICRON in 2013 and presently holds the position of Regional Application Specialist for transformer testing. Brandon’s focus is currently on standard and advanced electrical diagnostics for power transformers and circuit breakers.He is a well-known OMICRON instructor teaching electrical transformer diagnostic testing theory, application, and test result analysis. Brandon received a BSEE from the University of Maine.