

Sweep frequency response analysis (SFRA) is a popular test to confirm the mechanical and electrical integrity of a transformer. However, the resulting traces can be difficult for field personnel to interpret due to the visual nature of the data. It is more straightforward to compare numbers against prior data or against a stated limit than to interpret subtle differences in SFRA traces. If setup-related issues are not addressed during the testing process, return trips are often required to take additional shots to represent the transformer more accurately. These trips cost time and resources, so being able to identify a setup problem early can keep extra work to a minimum. A trained eye can focus in on a problem area quickly and identify a test setup issue promptly. Such confidence only comes at the expense of hours spent analyzing data. This article discusses common setup problems and their impacts.
Basic Concepts
SFRA testing hinges on sending a signal into a transformer winding at a known frequency and measuring back the signal received at the other end of the test circuit. This process is repeated across the desired frequency range. The difference between the signal that goes into the transformer and the signal that comes out is the attenuation of the signal, which is plotted on a vertical axis for each tested frequency on the horizontal axis. The individual data points become a trace as the test progresses and sweeps through the desired frequency. The attenuation is plotted as decibels (dB). The trace is plotted on a graph with high attenuation (very little signal returning to the test set) at the lowest ranges of the graph’s vertical axis, while very-low attenuation (most of the signal returning to the test set) is shown at the highest vertical ranges.
To summarize: The more negative the dB, the higher the attenuation; the closer it is to zero, the lower the attenuation.
The Test
The transformer under test is a network of resistive, inductive, and capacitive (RLC) elements made up of the transformer’s magnetic circuit, windings, insulation, and countless other components that create power transformers as we know them. The impedance of inductive and capacitive elements, by their nature, are dependent on physical properties — areas, lengths, distances. Therefore, changes to those physical properties will create a change in the impedance of the corresponding segment of the RLC network. Impedance is also dependent on frequency.
As the range of sweeping frequencies remains the same between different test sessions, damage, physical changes, and/or electrical changes that occur inside the transformer will change the impedance of various inductive and capacitive elements and will also change the level of attenuation of the input signal.
In addition, and perhaps even more important, these changes may yield different frequencies at which the inductive and capacitive elements resonate with each other when compared to previous tests. Observing left-right movement or the disappearance (or creation) of the various extrema points between different test sessions are key aspects to look for, as they indicate some physical or electrical changes to those capacitive and inductive elements. Extrema points are the local maximum and minimum points on the traces that resemble peaks and V-shaped valleys, to put a common visual to the term.
Concern Over Setup
In any electrical test, it is well understood that correct and consistent test setup is essential for repeatable, representative test results. SFRA tests are also dependent on consistent test setup between different test sessions. Changing setup may cause changes in the RLC network of the transformer by introducing varying capacitances, resistances, and inductances. This variation may mask other concerning changes in the transformer itself, or it may create false positives. If variations between past and present traces are noted, all efforts should be made to troubleshoot possible setup errors before accepting the traces as representative of the transformer.
Poor Grounding
Among the more common SFRA setup problems, poor grounding practices can massively impact the expected traces. This is not just the grounding of the transformer itself, but the entire grounding path of the measurement setup. If the grounding path introduces additional impedances due to poor connections, the signal will be measured with respect to a different reference, resulting in changes to the traces. Typically, poor tank grounding influences the entirety of the trace and may be seen across the high-voltage open circuit (HVOC), low-voltage open circuit (LVOC), and high-voltage short circuit (HVSC) traces. The traces may appear jagged, noisy, shifted to a higher (-)dB, and may not follow an expected shape.
Poor connections on the test lead ground clamps can also produce wide-ranging changes in the response and will most likely be apparent when comparing phases in a given test session. If the test lead ground clamp is not adequately grounded, the impedance of the test lead changes, impacting the higher frequencies of the swept range. The impact can move further down the frequency range with worsening ground lead connections. These seemingly minor changes to the grounding circuit can make dramatic changes similar to that shown in Figure 1. In less significant cases, the changes may begin much higher in the frequency range.
In Figure 1, the blue trace was captured during routine testing. The tester identified something was wrong and began to troubleshoot. The connections at the test lead grounds were cleaned up with a wire brush to ensure solid metal-to-metal contact. This resolved the initial issue and resulted in the red trace.
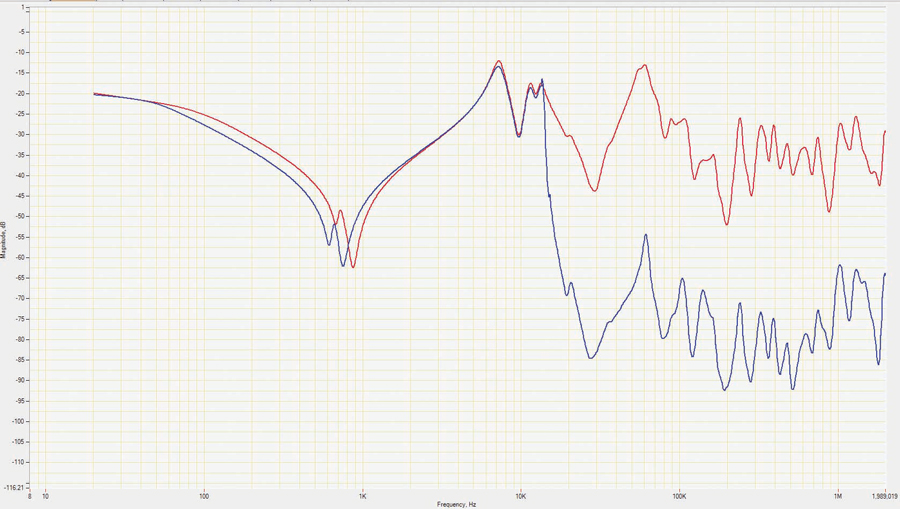
Figure 1: Drastic Example of Poor Lead Grounding
Poor Test Lead Connections
When test leads are poorly connected to the bushing terminals, extra impedances are introduced into the measurement lead circuit. These additional impedances cause the characteristic impedance of measurement cables to change, which will impact the response of the transformer. These impedance changes impact a wide range of frequencies and will yield poor comparison to prior traces with good lead connections.
In the traces shown in Figure 2, the red trace was captured initially. Noting the jagged nature of the trace, the tester determined that troubleshooting was required. Bushing terminal connections were cleaned thoroughly with a wire brush and solvent. After ensuring a robust metal-to-metal connection between the test lead clamps and the bushing terminals, the blue trace was captured. The resulting response follows an expected shape with less jagged features.
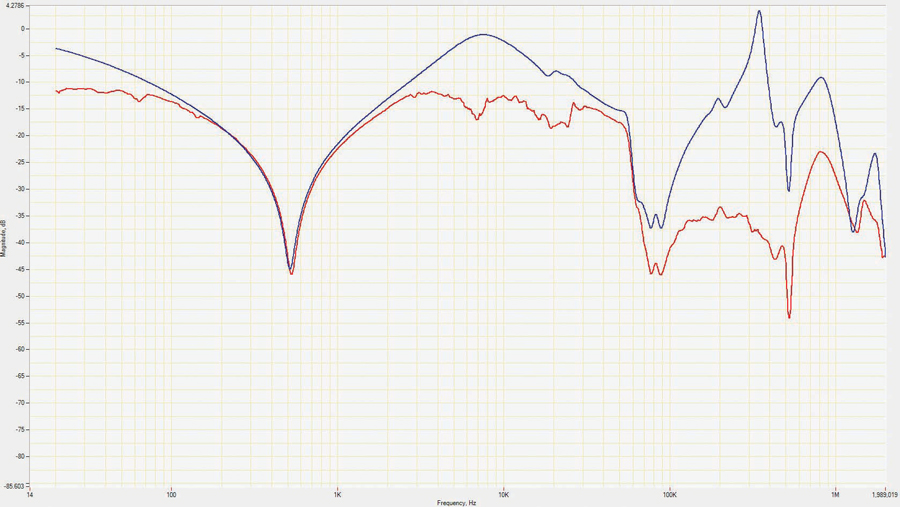
Figure 2: Example of Very Poor Test Lead Connection
Varying Tap Changer Positions
When load tap changers or deenergized tap changers (DETC) change position, the way the tapped winding interacts with the various RLC networks of the transformer will change. This interaction will impact the response of the swept frequencies through the transformer, and different tap positions will cause different responses. The extent of the differences will depend on the specific design of the transformer and the tap positions being compared. Tap changers should always be checked to ensure they are in the same positions as previously recorded traces prior to testing to ensure no additional uncertainties are introduced into the analysis. It should be noted that changing taps on one specific winding will not only impact that winding’s response, but may also impact the responses of other windings; for example, low-voltage open circuit traces may also change upon DETC position change on the high-voltage winding. This is due to the changing interaction between the RLC components of the high-voltage and low- voltage windings.
In the example in Figure 3, the prior (red) trace and the present (blue) trace were tested before and after a planned DETC position change. The transformer was fully tested before the DETC was moved to ensure it was in good condition and aligned with prior results. The unit was then tested after the DETC was moved to attain new baseline results. After changing DETC positions, new SFRA baseline traces should always be captured to enable future analysis.
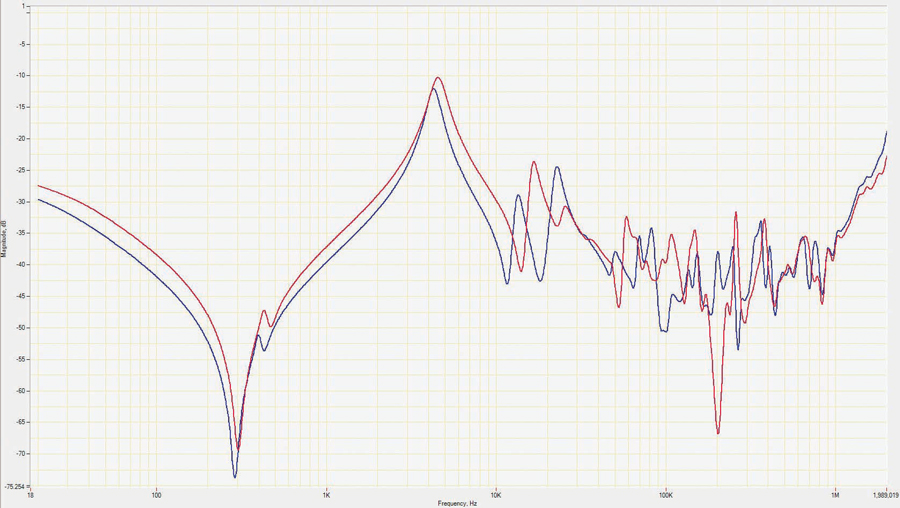
Figure 3: Drastic Example of Different Tap Changer Positions
In Figure 4, the red trace was captured just before a DETC change; the blue trace was captured immediately after a change. Notice how the changes are far less drastic than in Figure 3, which emphasizes how important the specific design of the transformer is to the degree responses may change when changing tap positions.
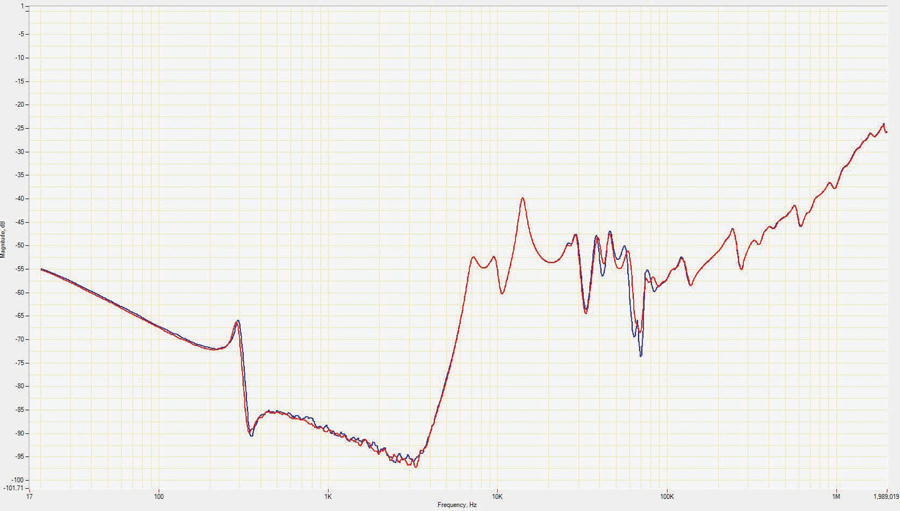
Figure 4: More Subtle Example of Different Tap Changer Positions
Stabilizing Tertiary Winding Configuration
Much like the impact varying tap positions may have on a transformer’s response, manipulating the configuration of a stabilizing tertiary winding can cause the transformer’s response to change. Some stabilizing tertiary windings may come out to a single bushing at one corner of the delta, which could be either grounded or ungrounded while the SFRA tests are performed on the primary and secondary windings. Some stabilizing tertiary windings have one corner of the delta brought out to two bushings, which can either be shorted and left floating, shorted and grounded, open and floating, or open and grounded. These changes will impact the interaction of the circuit elements that make up the RLC network inside the transformer and will result in variations to the response while performing SFRA tests. The changing response will most likely be seen in traces captured on all windings within the transformer, to varying degrees on each winding.
In the example shown in Figure 5, the prior (red) HVOC trace and the present (blue) HVOC traces were found to have different characteristics upon review in the field. After troubleshooting, it was determined that the stabilizing tertiary winding was in a different configuration when tested in the factory compared to the configuration when first assembled in the field. The tertiary was manipulated to be open, open and grounded, closed, and finally closed and grounded to ensure that a matching configuration was found. After testing in the exact tertiary configuration as in the initial trace, the responses lined up extremely well. After matching with the factory results, notes describing the test setup were documented to give testers more guidance for future SFRA testing.
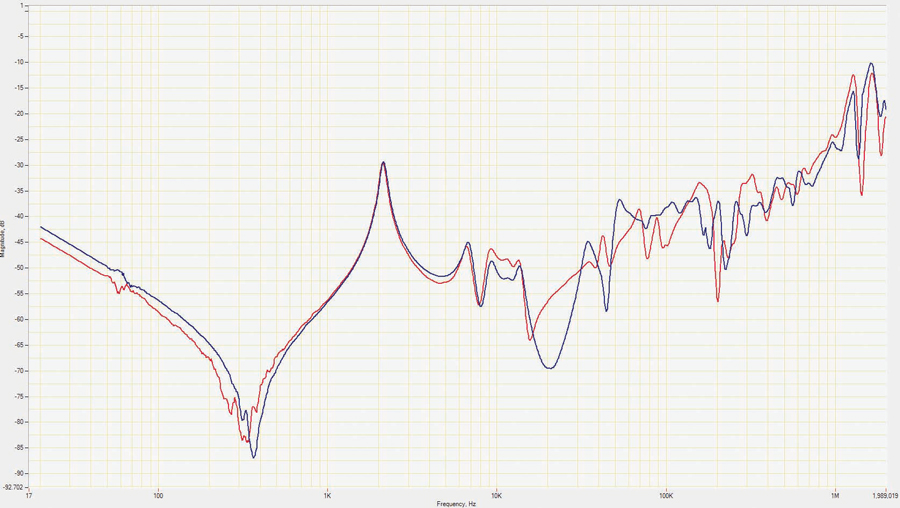
Figure 5: Varying of Stabilizing Tertiary Winding Configuration
Conclusion
It is essential to remember what an SFRA trace shows: the attenuation of the output signal compared to the input signal of the test set. As frequencies are varied, the inductive and capacitive elements that make up the transformer respond differently. Those inductive and capacitive elements are also dependent on physical parameters — lengths, areas, distances, materials — so physical or electrical changes inside the transformer will influence the way the countless inductive and capacitive elements respond to varying frequency. If the test setup does not remain consistent between test sessions, the interactions between the RLC parameters of the tested transformer will change and will show deviations between traces of different test sessions. These changes can be misleading to the tester and potentially mask other more meaningful issues. By identifying and ruling out possible setup discrepancies as the traces are being recorded, corrections can be made, and the setup can be adjusted immediately, ensuring the traces correctly and accurately represent the transformer’s condition.
 Michael D. Wolf, PE, is a Principal Engineer in the Client Services Engineering department at Doble Engineering in Folsom, California. He has been in the power industry since 2008 in substation commissioning and maintenance support roles. Michael has a BSEE from Clarkson University, a MEPE from Worcester Polytechnic Institute, and is a licensed electrical power engineer.