
Part 1 of this article, which was the cover story in the previous issue of NETA World, explored the need for high-voltage arc flash (HVAF) assessment to protect utility workers who are exposed to voltages above 15kV. It also compared various methods to calculate the incident energy from HV and MV electric arcs. Analyzing the results demonstrated that several methods can be used to calculate the incident energy generated by open-air, line-to-ground arc faults for systems within the range of NESC Table 410.2 and Table 410.3.
Part 2 discusses key driving factors that directly affect arc flash incident energy, along with PPE considerations for various scenarios. A real-life case study drives home the importance of high-voltage arc flash studies for utility applications.
Traditionally, all existing HVAF simulation programs (e.g., ARCPRO, Duke HFC) require a manual, time-consuming process to calculate incident energy because they do not contain network and protective device information. This article illustrates the importance of performing a HVAF assessment for utility applications and highlights the benefits of using a tool capable of limiting human error factors from data transfer across different platforms by performing incident energy calculations along with network short-circuit currents (phase and sequence) and protective device operating time.
Protection System Characteristics
The three most important driving factors that directly affect arc-flash energy are the short-circuit current, the gap between conductors, and the duration of the arc. Incident energy increases with higher short-circuit currents. However, due to the operation of protective devices (PD), higher short-circuit currents can result in lower incident energy because of faster PD operation. Similarly, the gap between conductors dominates the geometry of the arc column plasma and the voltage gradient, and the incident energy is significantly affected by the effect of this factor (EPRI TR-1022632). Accurate estimation of incident energy thus depends on the relationship between all three parameters. This section describes the operating characteristics of HV and MV protection systems assuming that accurate arc fault currents have been determined.
HV Transmission Line Protection and Clearing Time
HV protection systems are standardized and designed to operate at high speeds due to the nature and importance of the system and the devastating implications of sustained arc faults. In fact, government regulations and organizations such as the Federal Energy Regulatory Commission (FERC) ensure that energy services are economically efficient, safe, reliable, and secure. Utility protection engineers use a combination of protection schemes particularly for the bulk electric system. Step-distance protection that detects and operates for phase faults (3PH & LL) and directional ground overcurrent protection that typically detects and operates for ground faults (1LG, 2LG) are the most common protection elements for HV transmission systems. Protective relays detect faults and send trip signals to HV circuit breakers rather quickly. High incident energy levels most commonly arise due to slow fault clearing times and should be given paramount importance in a HVAF evaluation. High-resistance arc faults (purely resistive in nature) show a constant voltage drop proportional to the gap, and arc resistance will vary inversely with the current flowing through the arc. Distance protection components may need to be adjusted or shifted to account for resistive arc faults. Figure 1 depicts how a mho setting shifts the line impedance angle to gain greater arc resistance coverage while still maintaining coverage of the line.
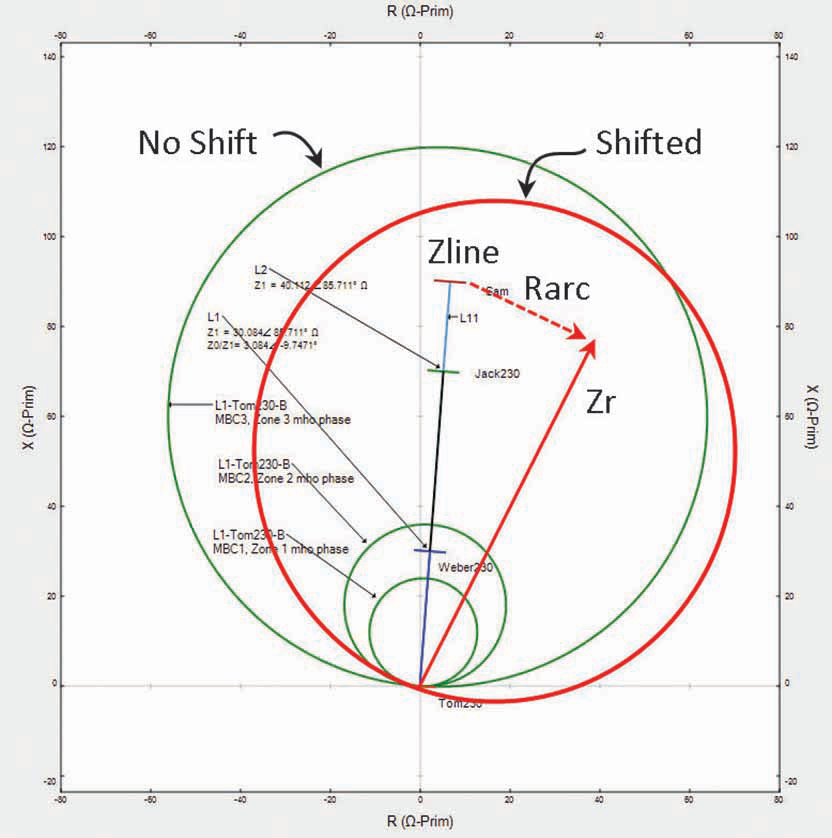
Figure 1: Distance Relay Mho Zone Shift for Arc Resistance
High-impedance ground faults also produce lower short circuit current (because of additional ground path resistance) and typically operate slower in a directional ground overcurrent protection scheme. Protective relays commonly operate with a 0.30-second delay for ground overcurrent protection. Other examples of delayed fault clearing include breaker failure, stuck breaker, or relay failure conditions.
The concept of sequential tripping for ground fault protection is an important part of transmission line protection. During a close-in ground fault condition, the close-in terminal would detect the fault in the instantaneous region (50G), and the remote terminal would detect the fault in the time region (51G). However, as soon as a close-in terminal breaker opens, the fault current reroutes, and more current flows through the remote terminal. This causes the time element to speed up into the instantaneous region.
High-voltage systems tend to have faster arc fault clearing times because distance relay protection is expected to operate fast. Distance relay (21-element) zones of protection include a main zone and backup-up zones. Typically, the first zone of protection is defined as Zone 1 (close-in). Arc faults in HV transmission systems are expected to produce fault currents and impedance zone detection within Zone 1 of the distance relay protection. Zone 1 protection typically has no delay and only detection time plus breaker opening time are considered to determine arc duration. Zone 2 and Zone 3 typically operate in 20–50 ms (1.5–3 cycles) and with 100–250 ms (6–15 cycles) delays. The delays are included to provide backup protection, coordination, and selectivity.
One way to determine a conservative arc fault exposure time (assuming a worst-case scenario) is to assume Zone 1 failure and instead use the Zone 2 time-delay operation. This adds a 20–50 ms delay to the incident energy estimation and brings total HV system arc fault clearing time for incident energy calculations to 70–120 ms (20–50 ms delay + 50–80 ms for breaker opening time). Zone 3 protection operation for arc fault conditions is rarely used for incident energy calculations.
It is common for HV protection engineers at the author’s utility company to assume 2-cycle delay for microprocessor detection time in the case of instantaneous protection. For Zone 2 protection, 18-cycle delay is programmed. It is also common to assume 5-cycle clearing time for HV breaker opening time.
A tool used to perform high-voltage arc-flash incident energy calculations should allow simulation of distance protection components to minimize the human error factor of engineers who traditionally have been performing this analysis using manual older technology.
Pole Construction and Gap Between Conductors
The length of the gap between conductors, which is directly related to incident energy, is also a factor. Typical line performance and design criteria clearly show that line-to-ground and line-to-line gaps between conductors vary significantly mainly because of the design voltage of the power system. Longer arc lengths produce larger heat energy sources. In high-voltage transmission lines, the arc length is longer, and the shape of the arc plasma column is very different from the more spherical shape arc encountered in low-voltage (short gap) equipment. HV arc plasma clouds may take on a cylindrical shape. An 110kV line could have a gap between phase and ground conductors as long as 1,100 mm, whereas a typical gap between phase conductors in MV switchgear is 152–305 mm (Figure 2 and Figure 5). The shorter gap plasma cloud can be approximated as spherical for incident energy modeling purposes.
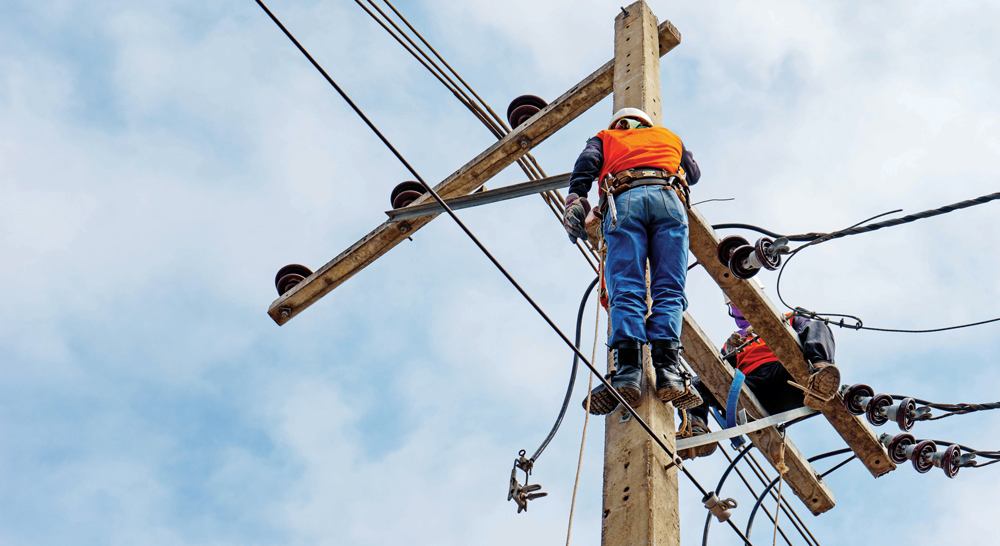
Figure 2: Linemen Working on a Short-Gap Distribution Line
Furthermore, longer gaps provide the arc more room to elongate and spread out in all directions. Arc elongation, a phenomenon described in Terzija and Konglin’s “Long Arc in Free Air: Laboratory Testing, Modeling, Simulation and Model-Parameters Estimation,” is not to be confused with the actual length between conductors. Arc movement along conductors caused by magnetic field forces is another factor that is not included in the methods proposed in this article; only the effect of longer arc length is considered in the models. Arc movement and arc elongation may cause the arc column and plasma to move away from the electrical worker; however, it can also cause the working distance to be reduced. This should be considered when selecting the working distance that will be used to determine the incident energy.
The authors use conductor gaps for a transmission line that vary with each type. For a 115kV overhead line (Figure 3, Figure 4, Figure 5), the gaps range from 2ft-6in for a compact, horizontal post line to as large as 11ft-3in for an H-frame type tower. On the other hand, the conductor gaps for high-voltage 34.5kV switchgear are shorter when compared to an overhead line. This is due to the lower voltage level, which permits shorter gaps without jeopardizing personnel safety.
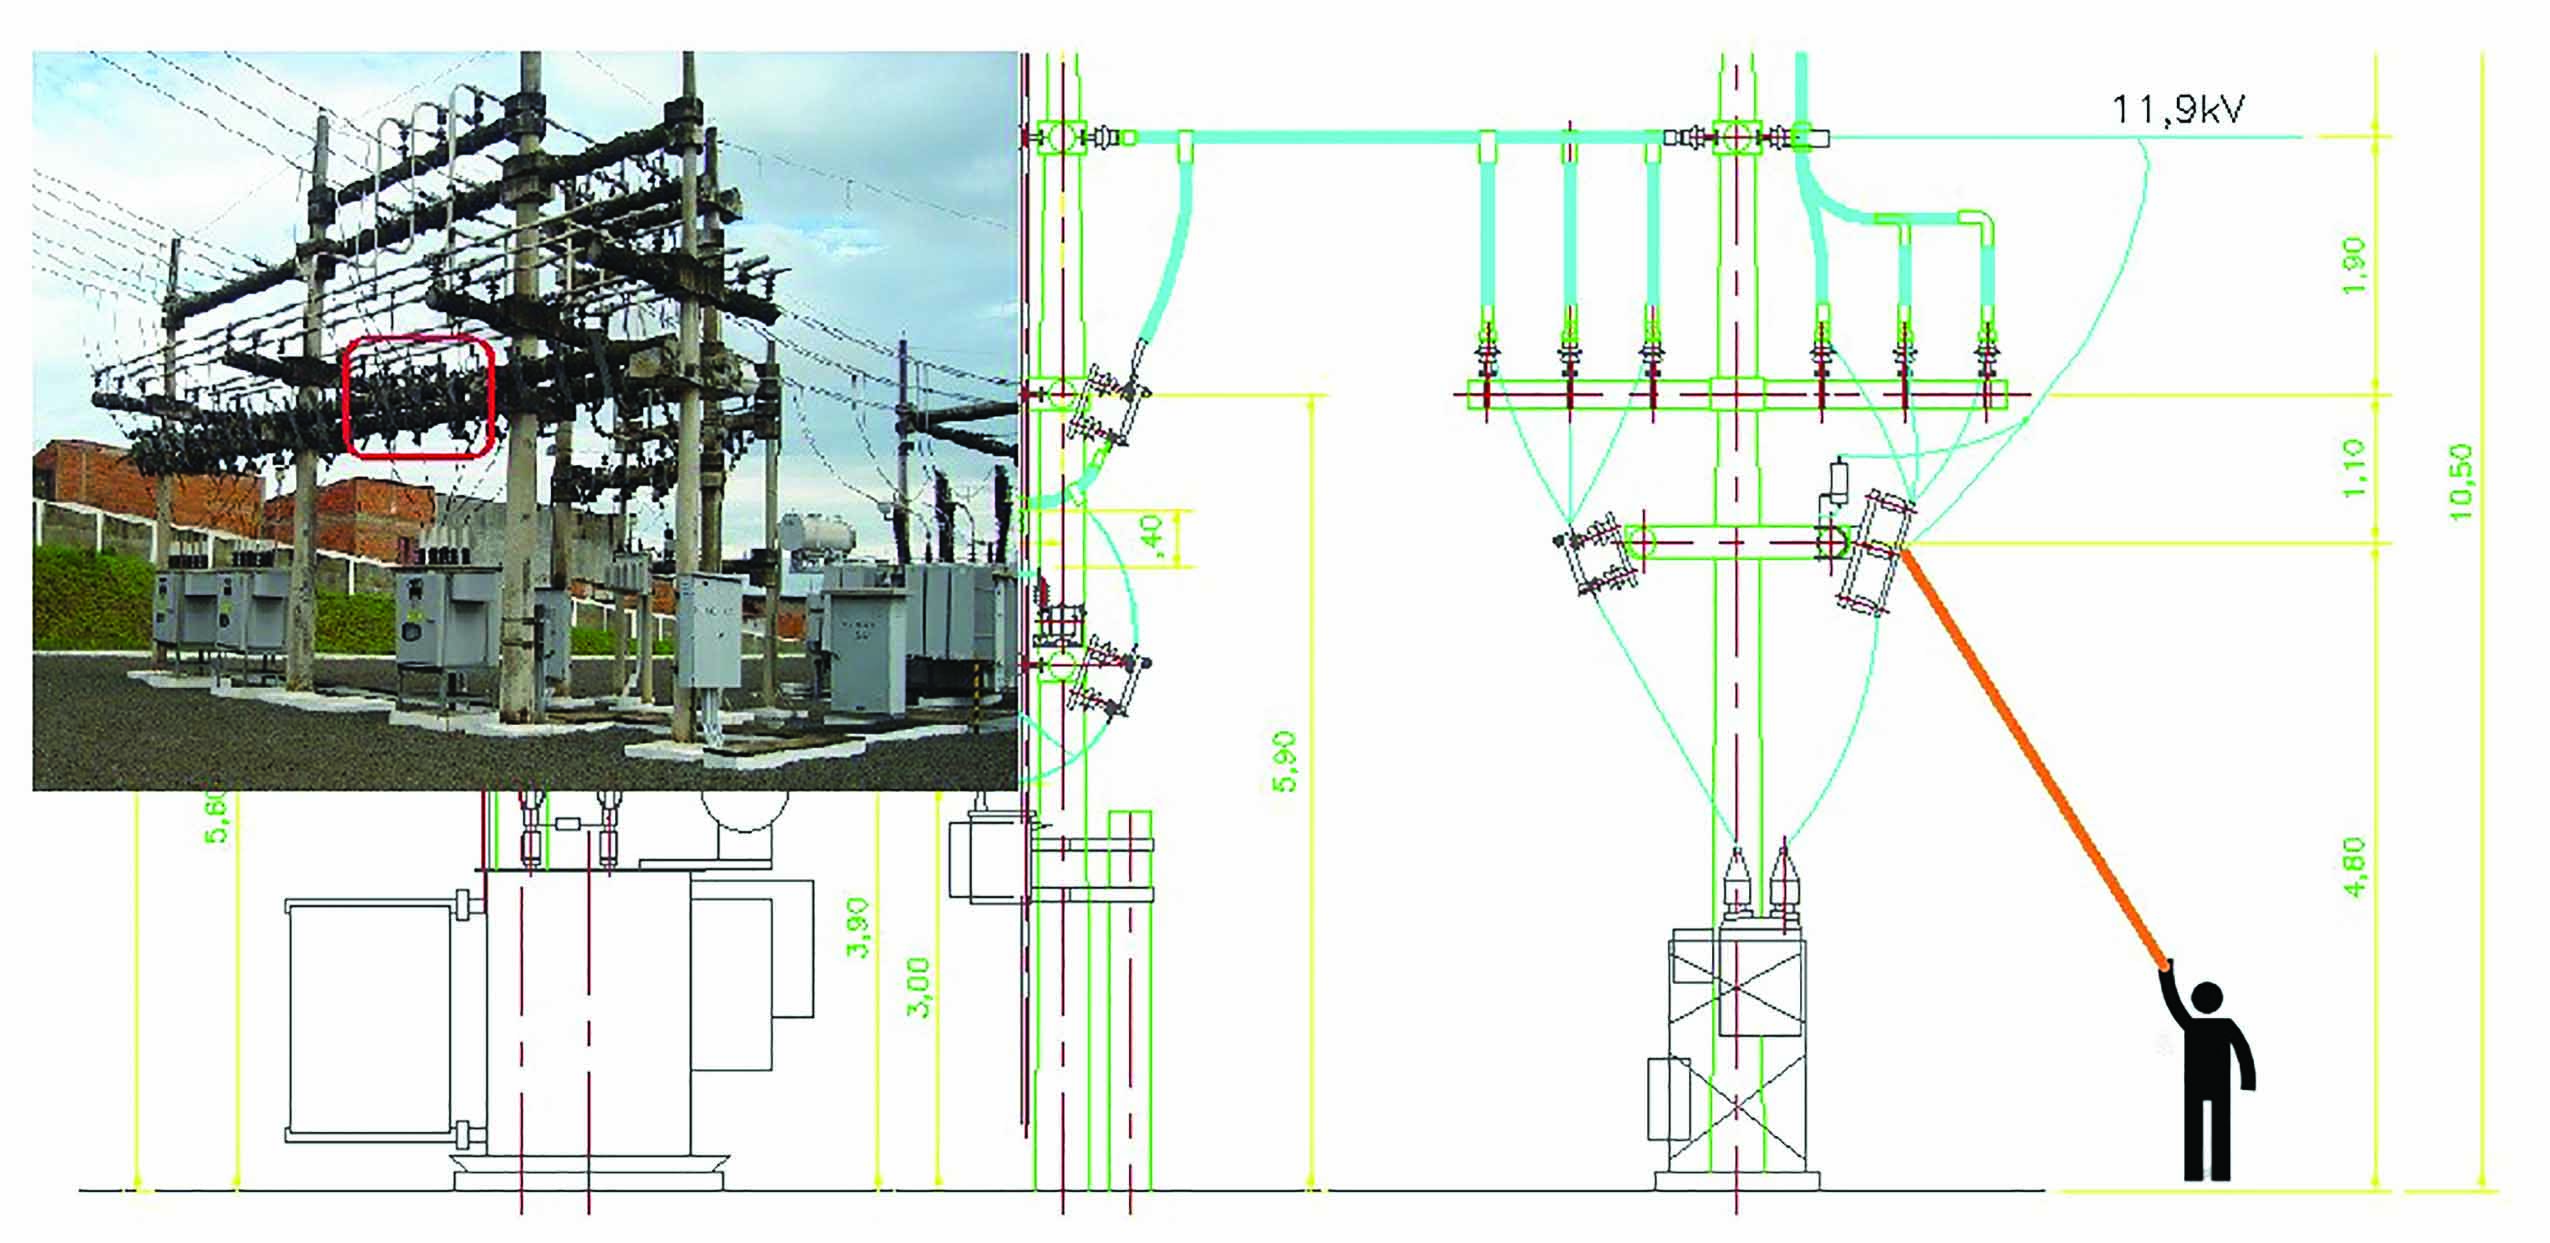
Figure 3: Outdoor Substation
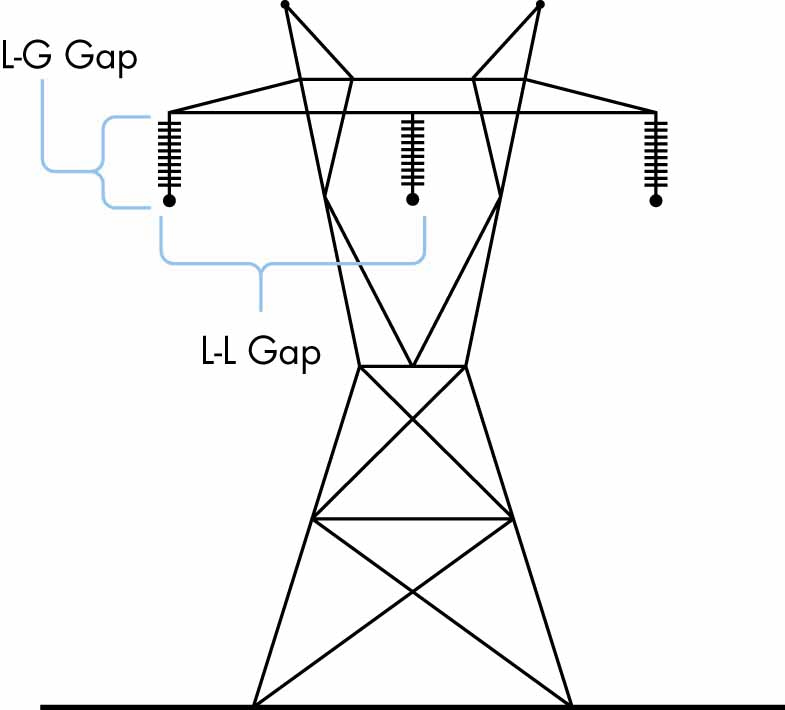
Figure 4: Transmission Lines
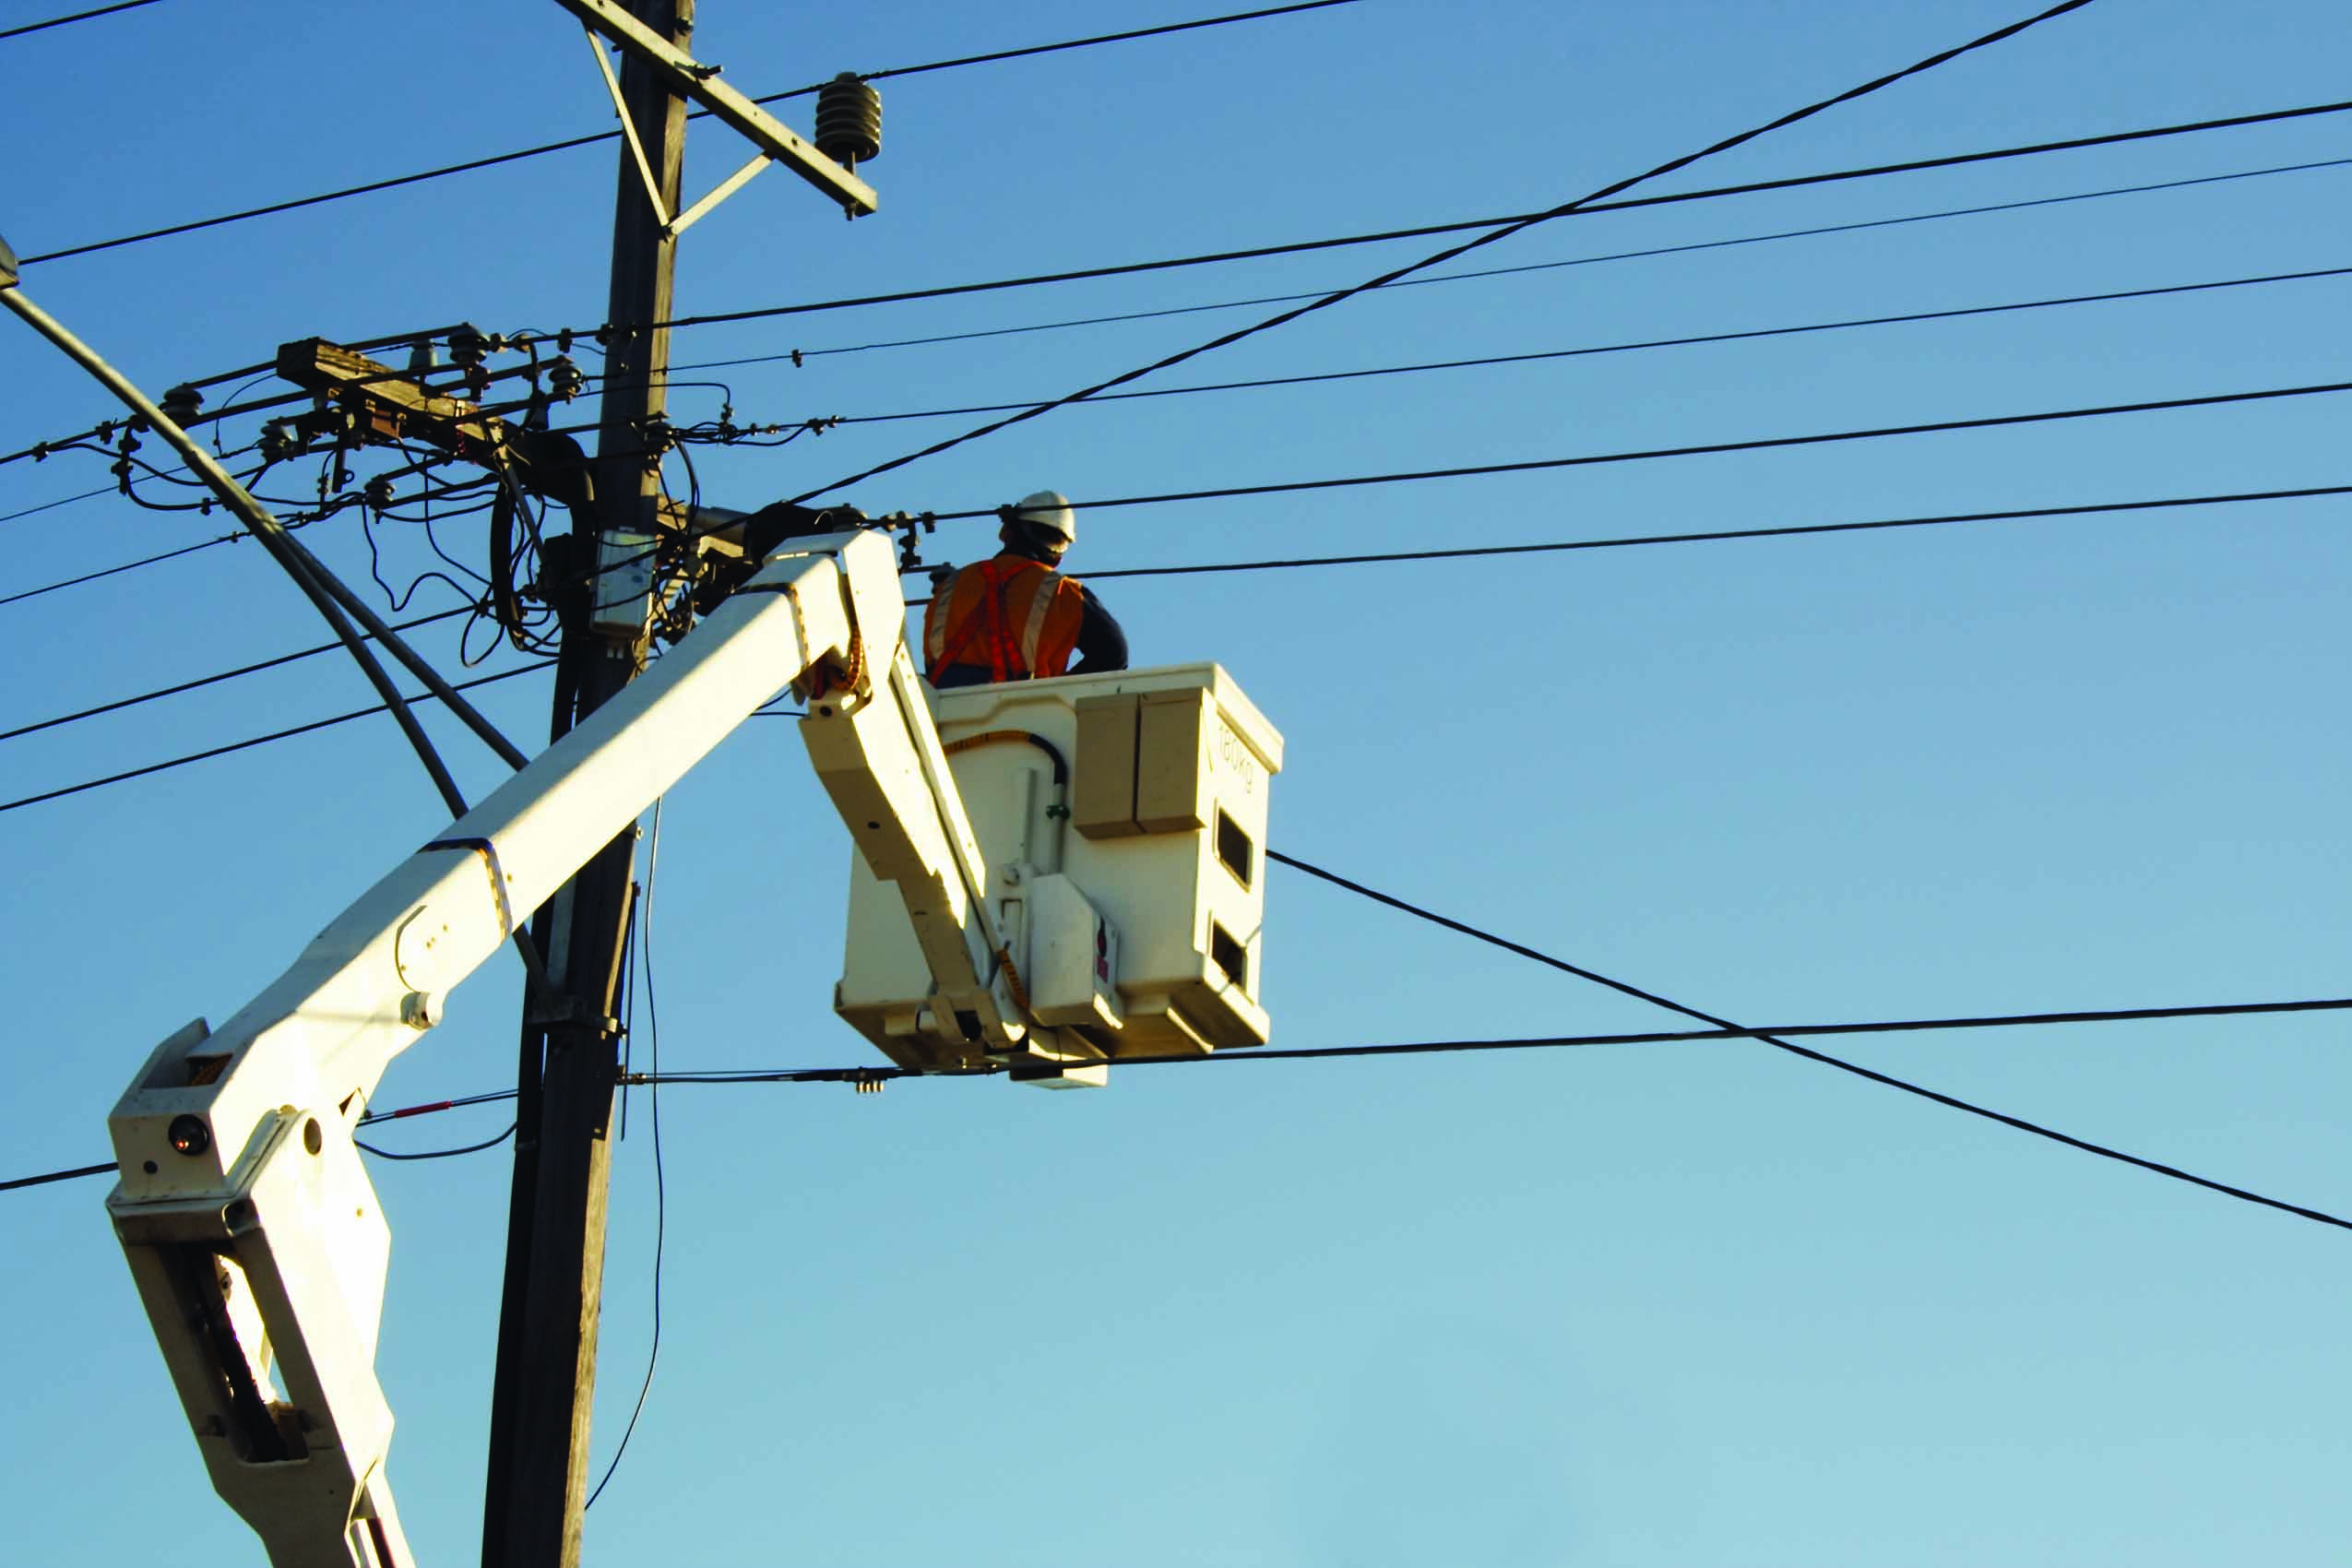
Figure 5: Distribution Lines
Case Study: Calculating HV and MV Arc Flash Incident Energy
To demonstrate HV incident energy calculations, a utility application consisting of high-voltage equipment has been prepared as an example of an HVAF assessment using simulation software that implements the EPRI and Terzija/Konglin methods. Two examples are provided:
- HV 115kV open air transmission line (Figure 6)
- MV 34.5kV switchgear for a renewable energy collector system (Figure 7)
Figure 6: 120kV Transmission Line Design
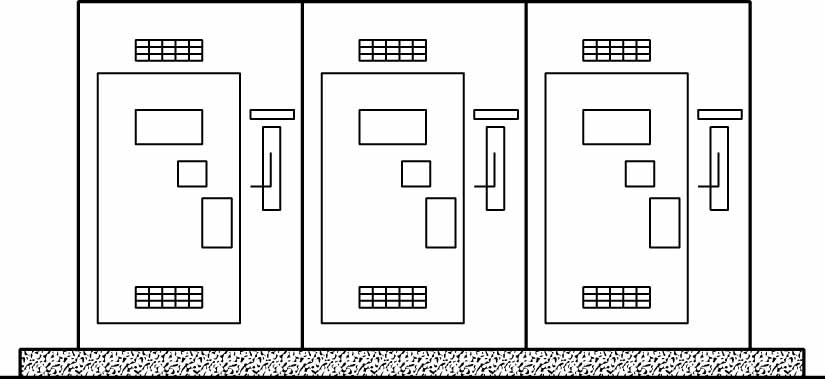
Figure 7: 34.5kV Outdoor Switchgear
The incident energy of the 115kV transmission line is calculated at five different locations (i.e., 0%, 25%, 50%, 75%, and 100% taps (Figure 8). The incident energy analysis is performed using typical overcurrent relay fault clearing times. The electrical properties including resistance, reactance, short-circuit current, and other input data are also shown in Figure 8. The dimensions of the equipment, gap between conductors, and working distance are included in the figure legends.
Figure 8: 115kV Transmission System One-Line Diagram
For the 115kV system, line-to-ground arc faults are examined at different fault clearing times (FCTs). The term “FCT” is used interchangeably with arc exposure duration. FCTs are determined based on typical transmission system protective device settings. For both junctions, the selected fault clearing times are 0.083 sec and 0.670 seconds, respectively. For faults on the transmission line taps (different segments along the line), a fault clearing time of 0.099 seconds is used.
The 35kV substation represents an outdoor collector system switchgear with available short-circuit current of 3.835kA. For this fault location, three-phase enclosed arc faults are examined with clearing times of 0.350 and 0.670 seconds, respectively.
Multiplying factors are used for each method (refer to individual method OEM reference manuals for details) to convert arc fault incident energy from L-G in open air to three-phase enclosed. The Duke Heat Flux Calculator does not offer direct inputs for correction factors; thus, they were applied manually. The ETAP ArcFault™, EPRI, and Terzija / Konglin methods presented in this paper are also adjusted using methodology described in R. Wilkins.
Case Study Results
Table 1 lists the methods compared in Tables 2–6.
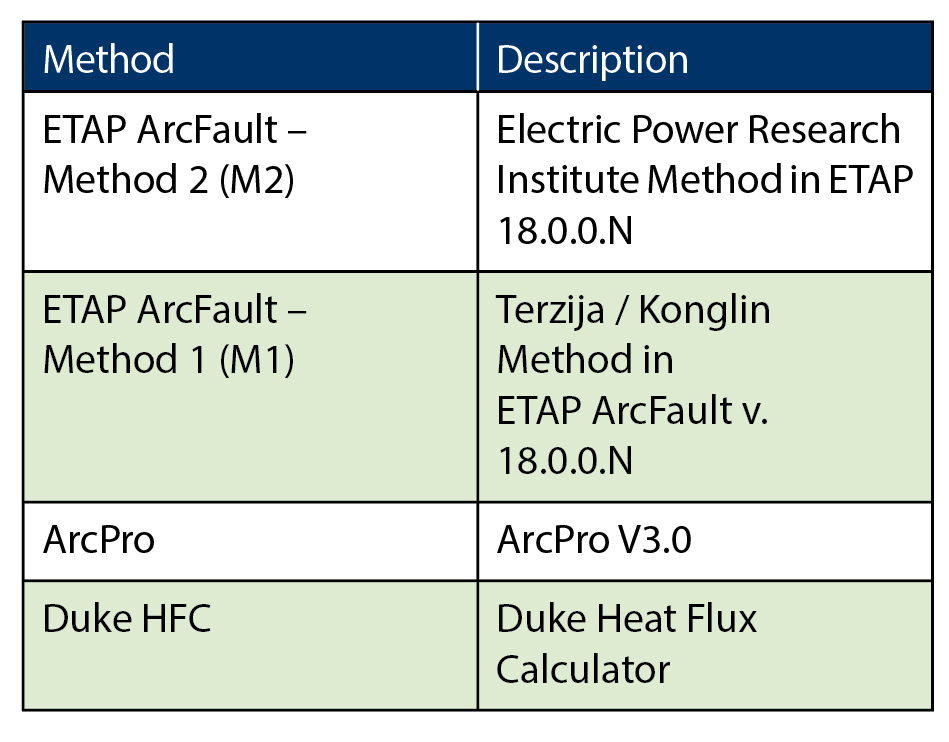
Table 1: Arc Fault Methods
Analysis
Analyzing the incident energy results of the four methods reveals several interesting findings and observations. The first general observation is that the results of the line to ground faults in open air are relatively close when the fault current values are within the range of the models. As the results at Junction 2 of Table 2 show, the incident energy difference is approximately 0.5/cm2 (the highest delta is between maximum and minimum results). The short-circuit current at this location is 22.147kA, which is approximately in the middle of the current range of the models (approximately 5kA to 40kA). As short-circuit current increases past the upper limits of the model towards a value of 45.29 kA, the incident energy difference can increase significantly. This is evident when observing the results of Junction 1 in table 3.
115 kV Transmission Line
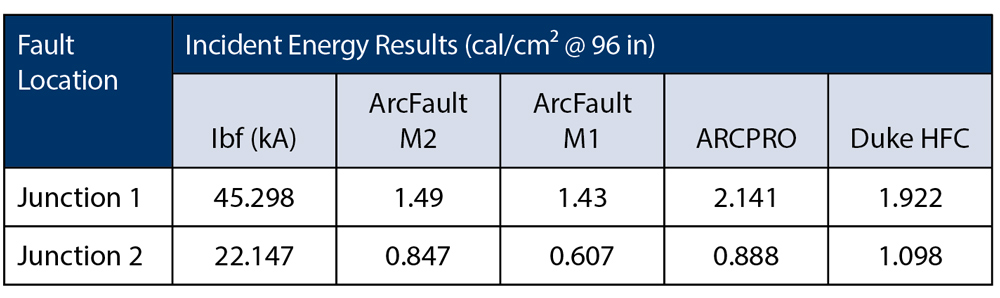
Table 2: L-G Arc Fault (AF) with Fault Clearing Time (FCT) = 0.083 Seconds
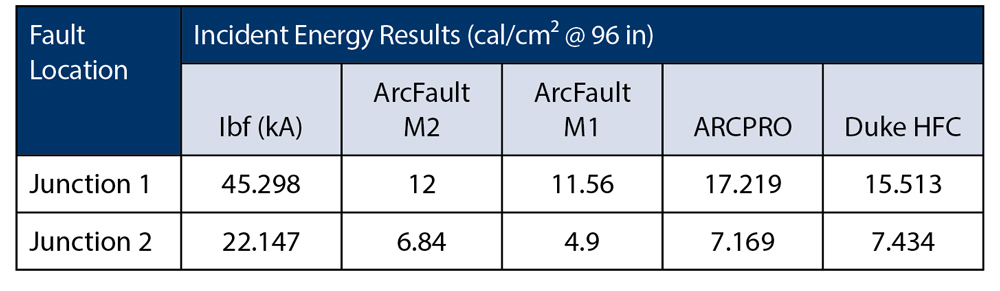
Table 3: L-G AF with FCT = 0.670 Seconds
Another basic observation from the results listed in Table 4 is that along the length of the line, energy flux appears to be directly proportional to the change in short-circuit current. Furthermore, when the arc-fault exposure time is 100 ms or less, incident energy is well below 2.0 cal/cm2. Utilities commonly assume a normalized arc fault exposure time along a transmission line segment to calculate the incident energy at different approach distances. The results in Table 4 assume an approach distance of 96 in. A high-voltage arc flash incident energy study may typically require the results to be presented at three different approach distances. It is also common for the results to be presented in the form of approach distances to different incident energy levels. In other words, at what approach distance is the incident energy exposure 2.0, 4.0, 8.0.… X.X cal/cm2?
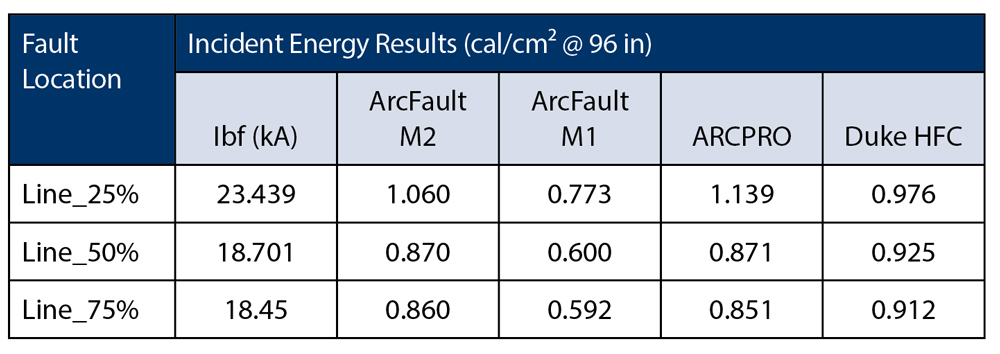
Table 4: L-G AF at Different Line Locations with FCT = 0.099 Seconds
One finding is related to the methods used to adjust the incident energy from open-air L-G to three-phase enclosed arc faults. Software manufacturers of high-voltage arc flash methods use different techniques to correct the energy flux. The correction factor to convert from L-G open air to three-phase open air varies between 1.5 and 2.5 p.u. The correction factor to convert from three-phase open air to three-phase enclosed varies between 1.5 and 3.5 p.u. Similar conversion factors were applied to make the comparisons in Table 5 and Table 6.
34.5 kV Switchgear
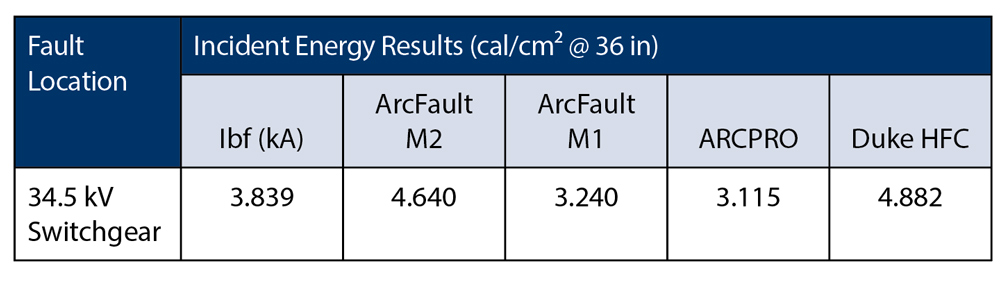
Table 5: 3-P AF on Outdoor Switchgear with FCT = 0.350 Seconds
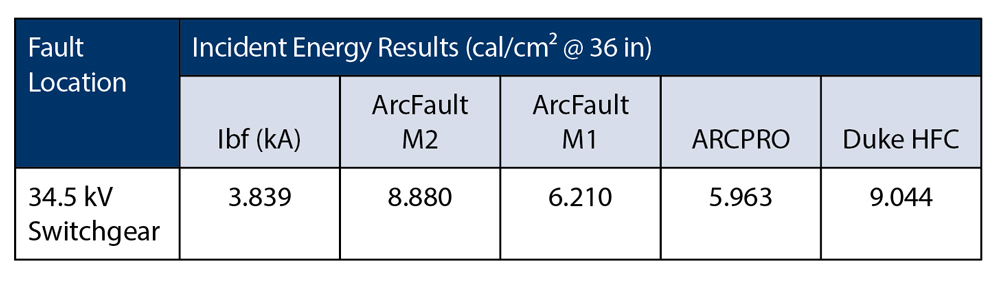
Table 6: 3-P AF on Outdoor Switchgear with FCT = 0.670 Seconds
Conclusion
The purpose of this paper was to explore and compare the various methods to calculate the incident energy from HV and MV electric arcs. New technology that considers the entire electrical network, calculates the short-circuit current, and simulates the response of various types of protective devices removes the main disadvantages of older methods requiring labor-intensive, single-solution-at-a-time approaches that are prone to human error factors.
References
A. Marroquin, A Rehman, A. Madani, “High Voltage Arc Flash Assessment and Applications,” IEEE IAS ESW Conference, Paper No. ESW2019-38, March 2019, Jacksonville, FL
T. A. Short, “Arc-Flash Analysis Approaches for Medium Voltage Distribution,” IEEE Transactions on Industry Applications, Vol. 47, No. 4, pp. 1902-1909, July/August 2011.
US Department of Labor, OSHA 1910.33, Occupational Safety and Health Administration Requirements.
NFPA 70-2017, National Electric Code, Quincy, MA: NFPA.
NFPA 70E-2018, Standard for Electrical Safety in the Workplace, Quincy, MA: NFPA.
EPRI TR-1022632, Arc Flash Issues in Transmission and Substation Environments: Results from Tests with Long Arcs, Electric Power Research Institute, Palo Alto, CA, 2011.
Parsons and A Marroquin, “A Framework for the Selection of Incident Energy Mitigation Technology,” IEEE IAS ESW Conference, Fort Worth, TX, 2018.
IEEE Std. 1584b-2011, IEEE Guide for Performing Arc Flash Hazard Calculations, New York, NY: IEEE.
Transpower TP.DS.62.01, Clearances and Conductor Spacings – and a safe access for ac switchyards, Issue 3, February 2009.
V.V. Terzija; H.J. Konglin, “Long Arc in Free Air: Laboratory Testing, Modeling, Simulation and Model-Parameters Estimation,” IEE Proceedings: Generation, Transmission and Distribution, Vol. 149, No.3, pp. 319-325, May 2002.
V.V. Terzija, H.J. Konglin, “New Approach to Arc Resistance Calculation,” IEEE Power Engineering Society Winter Meeting, February 2001.
R. Wilkins, “Simple Improved Equations for Arc Flash Hazard Analysis,” August 30, 2004. Online IEEE Electrical Safety Forum https://www.ieeecommunities.prg/ieee.esafety.
T. A. Short, “Arc Flash Analysis Approaches for Medium-Voltage Distribution,” Rural Electric Power Conference, May 2009.
NESC C2-2017, National Electrical Safety Code, New York, NY: IEEE.
IEEE 1584-2018 D6, Approved Draft Guide for Performing Arc-Flash Hazard Calculations, New York, NY: IEEE.
R. F. Ammerman, T. Gammon, P. K. Sen, and J. P. Nelson, “A Comparative Study of Arc Modeling and Arc Flash Incident Energy Exposures,” IEEE Petroleum and Chemical Industry Technical Conference, 2008.
IEEE Std. 1584-2002, IEEE Guide for Performing Arc Flash Hazard Calculations, New York, NY: IEEE.
Central Station Engineers of Westinghouse Electric Corp., Electrical Transmission and Distribution Reference Book, East Pittsburgh, PA: Westinghouse Electric Corp.,1964.
Federal Energy Regulatory Commission, Strategic Plan FY 2018-2022, September 2018.
NERC, “Glossary of Terms Used in NERC Reliability Standards,” July 2018.
Working Group D8, “Justifying Pilot Protection on Transmission Lines,” IEEE Power Engineering Society, 2008.
 Albert Marroquin, BSEE, PE, IEEE Senior Member, is Vice President, Validation & Verification, and Senior Principal Electrical Engineer at ETAP. A registered Professional Engineer in the state of California, he is the main designer and product manager for ETAP’s AC and DC Arc Flash products, a working group member of IEEE 1584 and IEEE 1458, and an active attendee at NFPA 70E seminars and meetings.
 Abdur Rehman, BSEE, MSEE, PE, is the Relay Operations Supervisor at Puget Sound Energy, where he leads a team of relay technicians who maintain, troubleshoot, and commission protection systems throughout PSE territory. Abdur brings a wealth of high-voltage experience in protection engineering and has performed various power system studies, high-profile incident investigations, troubleshooting, and RCAs.
 Ali Madani, BSEE, is the lead Power Systems Engineer at AllumiaX Engineering. Ali has performed various power systems studies including modelling, short-circuit, coordination, and arc-flash studies for a variety of low- and medium-voltage facilities.