

Asset failures versus time are often non-linear. As assets degrade over time, the degree of degradation and the rate of degradation often increase. If asset degradation were linear, the rate of degradation would be constant.
This implies that an asset, such as a circuit breaker, could function properly for approximately 30 years, develop a detectable defect at year 31, and fail at year 35 (or even sooner). This phenomenon is often conveyed by the potential failure (P–F) curve, which illustrates the nonlinearity of asset condition: An asset’s condition is good at the time of installation, remains satisfactory throughout much of its lifespan, and then degrades at ever-faster rates toward the end of its lifespan (Figure 1).

OFF-LINE ASSESSMENTS
This nonlinearity of failure poses particular problems for off-line assessments of equipment, such as power factor or insulation resistance testing. Off-line assessments, by definition, require outages, which are challenging for the owner due to loss of production time and reduced revenue. Outages also pose risks, such as poorly reassembled equipment and loose connections. As a result, off-line assessments are performed sparingly. For example, a utility might test a transmission transformer or circuit breaker using a time-based maintenance schedule, and the cycle time may be driven by the criticality of the equipment.
This wide maintenance interval creates the potential for defects to develop and go unnoticed. Suppose a utility tested a 230-kV transformer bushing in January 2025, and a microfissure formed in the porcelain the next month. A three-year maintenance scheme composed of only off-line assessments would fail to intercept that fissure until January 2028. During that time, the fissure could develop into a serious crack that could compromise the integrity of the bushing and cause a catastrophic failure.
One way to reduce this risk is to increase test frequency. For example, transformer bushings could be tested annually rather than every three years. This would produce more data per unit of time, thereby hastening the identification of asset deviations from the norm. However, even this schedule assumes that one datum per year would suffice to identify asset deviations from normality. The trouble with this approach is dispersion.
Dispersion Matters
Anyone who has conducted insulation resistance testing knows that, while valuable as a trendable parameter, insulation resistance is subject to considerable dispersion, even if you correct for temperature. Dispersion is also affected by humidity, which has no correction factor, as well as other factors. The most common measure of dispersion is standard deviation. If you conduct one-minute insulation resistance tests repeatedly on the same asset during one hour, you receive a range of results yielding a non-zero standard deviation. Consequently, if you conduct an insulation resistance test on an asset every day for 400 days, your data set could look something like Figure 2.

The range of this large data set is 55 GΩ. The standard deviation is 13.85 GΩ. This means, on average, the data diverges from the mean by about 13.85GΩ. Suppose a utility followed an annual maintenance regime (daily is impractical) and conducted insulation resistance tests on day 22 and day 387 (365 days apart) of the graph. As shown, the insulation resistance was 72 GΩ on day 22 and 80 GΩ on day 387. This small data set would give the utility the impression that the insulation resistance of the asset was holding steady.
However, a large data set of values captured daily would suggest the opposite, that the insulation resistance is steadily decreasing. The small data set (72 GΩ and 80 GΩ) wouldn’t prompt any interventions from the asset owner. By contrast, the large data set might convince the utility to investigate. This is why trending data based on annual testing may not be effective for identifying equipment deterioration.
Dispersion, which is defined as the extent to which numerical data is likely to vary around an average value, also applies to other diagnostics. I once ran power factor tests on an SF6 circuit breaker for a customer who was insistent on not getting negative values. Negative power factors are common on UST mode with SF6 breakers, and power factor is a dubious parameter for very-low-capacitance assets. Catering to this customer meant running perhaps a dozen ungrounded specimen tests per breaker. This produced a dozen distinct test results, some positive, some negative, with a considerable standard deviation.
On-Line Assessments
On-line assessments — those made while assets remain energized — can fill in the data gap that plagues off-line assessments. Because on-line assessments do not require outages, they can be made with far higher frequency. And since they can be made with a higher frequency, they can gather the data to intercept defects that off-line assessments may take too long to notice. Let’s view some on-line assessments of SF6 circuit breakers as examples.
Visual Inspection
The most basic on-line assessment for an SF6 unit is visual inspection, and perhaps nothing is more important during a visual inspection than checking the pressure gauge. Figure 3 shows an SF6 pressure gauge of an energized 121-kV circuit breaker, with the needle sitting at around 15 psig, well below the minimum acceptable pressure of 57 psig according to the data plate.
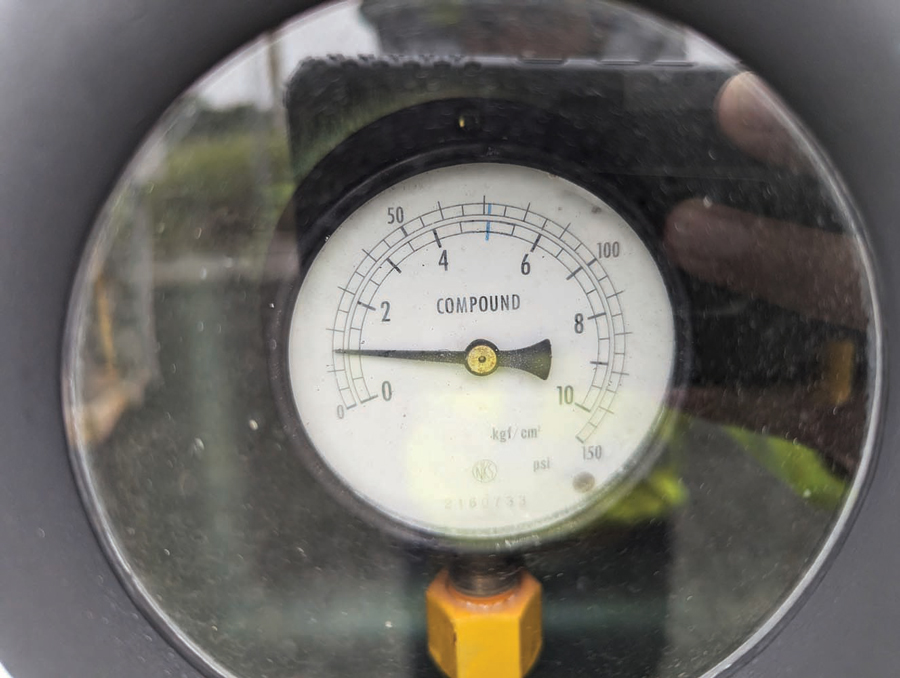
No alarm or lockout functions asserted, as should have been the case. I discovered this during downtime at a substation while working on a completely different circuit breaker. Lest anyone think that the gauge malfunctioned, when the breaker was repressurized, the needle climbed back to the green line just past 70 psig. Had the gas density reached breakdown voltage, a ground fault would have ensued and likely destroyed the unit. I’ve developed the habit of checking every pressure gauge in substations, provided I have the time.
Infrared Thermography
Infrared thermography is my favorite tool due to its wide applicability and accessibility. A wide range of defects developing unbeknownst to asset owners can be discovered during an infrared survey, including an anomaly I discovered in the same substation as the low gas pressure incident. Figure 4 shows a thermogram as well as a visible image of what appears to be partial discharge occurring at the camera crosshairs just above the flange and just below the last insulator skirt of a 121-kV SF6 breaker bushing.
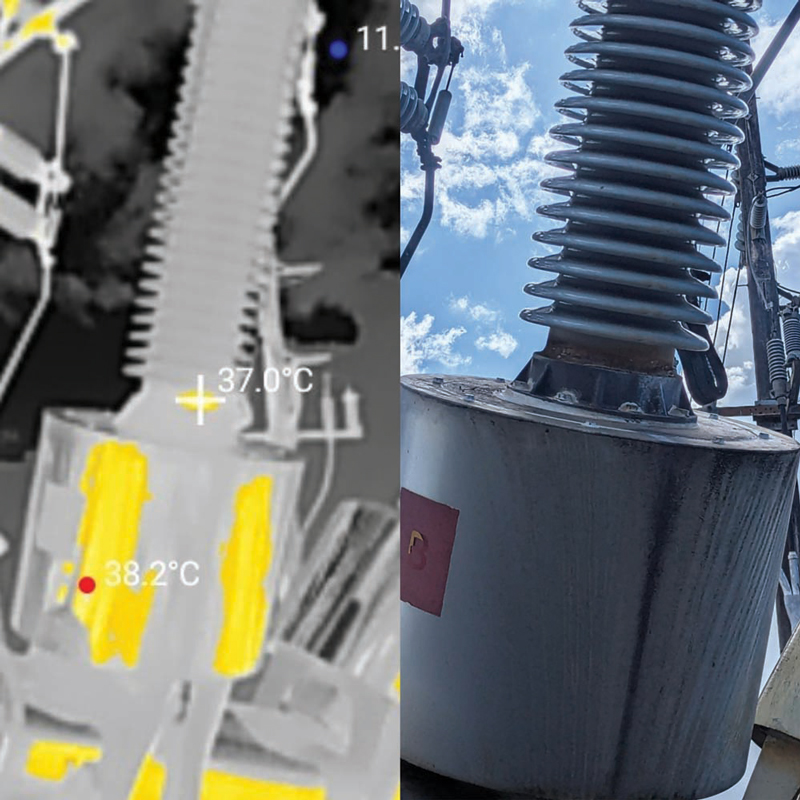
Partial discharge like this is typically detected via acoustic or ultraviolet cameras, but the heat from mature partial discharge can be detected with an infrared camera.
Figure 5 is a zoomed-in visible image of the hotspot. Notice the damage incurred by the weather sealant/cement used where the porcelain of the bushing meets the metal of the flange. This is a common location for contamination and a source of measurement distortion for off-line testing.

While the exterior of a transmission or distribution breaker serves as a perfect candidate for an infrared scan, we must not forget the interior, including the breaker control cabinet. Figure 6 illustrates clear overheating and thermal damage at a CT wiring terminal. While this anomaly was discovered via a visual inspection, it would have appeared even more conspicuously on an infrared survey.

PRINTED WITH PERMISSION FROM ADAM MURRAY[2]
Gas Analysis
Lastly, gas analysis is a valuable on-line assessment that can be done on energized breakers, provided the manufacturer permits. Figure 7 shows the results of an SF6 analysis I conducted several months ago. Note the elevated sulfur dioxide content. Sulfur dioxide is a decomposition byproduct of SF6 in the presence of electric arcing; thus, it can be used to assess the integrity of a breaker after it has interrupted fault current, instead of waiting until the next maintenance period. In the absence of the manufacturer’s literature, SF6 results should be graded in accordance with ANSI/NETA MTS, Standard for Maintenance Testing Specifications for Electrical Power Equipment and Systems, Table 100.13.

CONCLUSION
Nothing written here is meant to disparage or discourage off-line assessments. Some tests simply cannot be done while assets are energized. However, just like the decision to surgically remove a cancerous tumor might be informed by a monitoring tool such as a mammogram, the decision to recondition transformer oil or replace SF6 tank components might be informed by a monitoring tool like fluid analysis.
On-line assessments (literally) fill in maintenance time gaps and help mitigate the issue of data dispersion that off-line assessments suffer from. And as our on-line assessments become more sensitive and investigate more asset domains, potentially fatal defects will be detected faster, making interventions cheaper and improving safety.
REFERENCES
- Blann, Dale R. “Maximizing the P-F Interval through Condition-Based Maintenance.” Maintworld. July 10, 2013.
- Murray, Adam. (n.d.). “Thermal Damage at CT Wiring Terminal.”

Michael Labeit is a Prime Power Production Specialist, Lineman, a Power Systems Technician for RESA Power, and a NETA Level 3 Technician in the 249th Engineer Battalion, U.S. Army Corps of Engineers. He has operated and maintained medium-voltage power plants in Turkey and Saudi Arabia as well as at Ft. Leonard Wood, Missouri, and Ft. Bragg, North Carolina. Labeit graduated from Prime Power School in 2018 and has an AAS from Excelsior College.